|
Download Data (XLS File) |
|
||||||||
|
||||||||
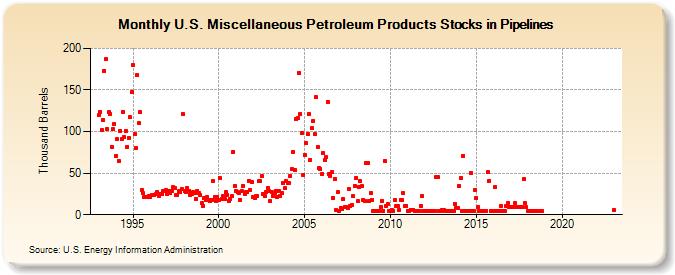
| U.S. Miscellaneous Petroleum Products Stocks in Pipelines (Thousand Barrels) | ||||||||
| Year | Jan | Feb | Mar | Apr | May | Jun | Jul | Aug | Sep | Oct | Nov | Dec |
|---|---|---|---|---|---|---|---|---|---|---|---|---|
| 1993 | 120 | 124 | 102 | 114 | 173 | 187 | 103 | 123 | 121 | 82 | 103 | 109 |
| 1994 | 71 | 91 | 65 | 101 | 91 | 124 | 93 | 101 | 82 | 92 | 117 | 147 |
| 1995 | 180 | 97 | 80 | 168 | 110 | 123 | 30 | 26 | 21 | 21 | 21 | 23 |
| 1996 | 21 | 24 | 24 | 24 | 25 | 27 | 23 | 25 | 25 | 28 | 29 | 30 |
| 1997 | 25 | 28 | 26 | 29 | 33 | 32 | 24 | 24 | 28 | 27 | 31 | 121 |
| 1998 | 28 | 27 | 32 | 29 | 24 | 25 | 27 | 26 | 19 | 29 | 26 | 24 |
| 1999 | 14 | 11 | 20 | 18 | 21 | 18 | 17 | 18 | 40 | 21 | 17 | 21 |
| 2000 | 18 | 44 | 19 | 23 | 19 | 27 | 24 | 17 | 19 | 23 | 76 | 35 |
| 2001 | 29 | 27 | 26 | 18 | 28 | 35 | 25 | 27 | 27 | 41 | 30 | 39 |
| 2002 | 21 | 20 | 22 | 22 | 40 | 40 | 46 | 25 | 23 | 27 | 32 | 28 |
| 2003 | 16 | 27 | 22 | 26 | 29 | 21 | 29 | 23 | 26 | 38 | 32 | 40 |
| 2004 | 38 | 38 | 46 | 55 | 76 | 54 | 115 | 116 | 171 | 121 | 98 | 48 |
| 2005 | 72 | 86 | 97 | 121 | 66 | 104 | 113 | 97 | 141 | 82 | 56 | 55 |
| 2006 | 49 | 74 | 66 | 69 | 136 | 49 | 47 | 51 | 20 | 43 | 6 | 27 |
| 2007 | 5 | 8 | 7 | 19 | 9 | 9 | 8 | 31 | 11 | 12 | 22 | 35 |
| 2008 | 44 | 16 | 33 | 40 | 34 | 18 | 17 | 62 | 62 | 17 | 26 | 18 |
| 2009 | 5 | 5 | 5 | 5 | 5 | 9 | 17 | 5 | 65 | 11 | 13 | 5 |
| 2010 | 5 | 6 | 5 | 18 | 10 | 10 | 6 | 18 | 18 | 26 | 11 | 11 |
| 2011 | 5 | 5 | 6 | 6 | 6 | 5 | 5 | 5 | 5 | 11 | 22 | 5 |
| 2012 | 5 | 5 | 5 | 5 | 5 | 5 | 5 | 5 | 45 | 45 | 5 | 5 |
| 2013 | 6 | 6 | 5 | 5 | 5 | 5 | 5 | 5 | 5 | 13 | 8 | 8 |
| 2014 | 35 | 44 | 5 | 71 | 5 | 5 | 5 | 5 | 50 | 5 | 5 | 30 |
| 2015 | 20 | 9 | 5 | 5 | 5 | 5 | 5 | 5 | 51 | 41 | 5 | 5 |
| 2016 | 5 | 33 | 5 | 5 | 5 | 10 | 5 | 5 | 5 | 10 | 14 | 9 |
| 2017 | 9 | 9 | 9 | 14 | 9 | 9 | 9 | 9 | 9 | 43 | 14 | 9 |
| 2018 | 5 | 4 | 4 | 4 | 4 | 4 | 4 | 4 | 4 | 4 | 4 | |
| 2023 | 6 | |||||||||||
| - = No Data Reported; -- = Not Applicable; NA = Not Available; W = Withheld to avoid disclosure of individual company data. |
| Release Date: 3/29/2024 |
| Next Release Date: 4/30/2024 |