|
Download Data (XLS File) |
|
||||||||
|
||||||||
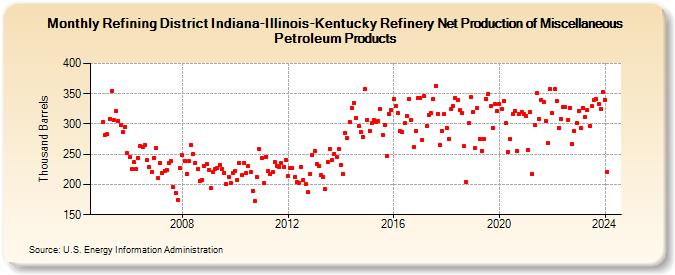
| Refining District Indiana-Illinois-Kentucky Refinery Net Production of Miscellaneous Petroleum Products (Thousand Barrels) | ||||||||
| Year | Jan | Feb | Mar | Apr | May | Jun | Jul | Aug | Sep | Oct | Nov | Dec |
|---|---|---|---|---|---|---|---|---|---|---|---|---|
| 2005 | 303 | 282 | 283 | 309 | 355 | 306 | 321 | 305 | 299 | 287 | 295 | 252 |
| 2006 | 245 | 225 | 237 | 225 | 244 | 264 | 262 | 266 | 240 | 229 | 221 | 244 |
| 2007 | 261 | 210 | 235 | 219 | 223 | 224 | 236 | 238 | 195 | 186 | 175 | 227 |
| 2008 | 248 | 239 | 217 | 238 | 266 | 251 | 236 | 225 | 205 | 207 | 230 | 234 |
| 2009 | 224 | 194 | 221 | 225 | 227 | 233 | 225 | 219 | 200 | 212 | 203 | 219 |
| 2010 | 223 | 208 | 236 | 215 | 236 | 219 | 230 | 220 | 190 | 172 | 212 | 259 |
| 2011 | 243 | 202 | 246 | 223 | 218 | 220 | 237 | 231 | 229 | 235 | 229 | 241 |
| 2012 | 214 | 227 | 227 | 212 | 204 | 203 | 229 | 207 | 201 | 187 | 217 | 249 |
| 2013 | 255 | 234 | 231 | 215 | 213 | 192 | 237 | 259 | 241 | 251 | 246 | 259 |
| 2014 | 233 | 218 | 285 | 276 | 304 | 326 | 335 | 310 | 296 | 287 | 279 | 357 |
| 2015 | 307 | 289 | 301 | 306 | 303 | 305 | 325 | 282 | 298 | 247 | 317 | 323 |
| 2016 | 341 | 330 | 318 | 289 | 286 | 302 | 314 | 342 | 307 | 262 | 288 | 343 |
| 2017 | 343 | 274 | 346 | 296 | 315 | 318 | 342 | 363 | 317 | 266 | 289 | 316 |
| 2018 | 294 | 275 | 324 | 330 | 343 | 339 | 323 | 318 | 263 | 204 | 301 | 344 |
| 2019 | 320 | 260 | 327 | 275 | 256 | 275 | 342 | 350 | 329 | 294 | 333 | 321 |
| 2020 | 333 | 324 | 338 | 301 | 254 | 275 | 316 | 322 | 256 | 317 | 320 | 316 |
| 2021 | 314 | 257 | 320 | 217 | 298 | 351 | 309 | 340 | 337 | 305 | 269 | 358 |
| 2022 | 318 | 357 | 338 | 294 | 309 | 328 | 328 | 307 | 327 | 267 | 288 | 302 |
| 2023 | 322 | 293 | 326 | 312 | 323 | 296 | 329 | 340 | 341 | 333 | 325 | 353 |
| 2024 | 340 | |||||||||||
| - = No Data Reported; -- = Not Applicable; NA = Not Available; W = Withheld to avoid disclosure of individual company data. |
| Release Date: 3/29/2024 |
| Next Release Date: 4/30/2024 |