|
Download Data (XLS File) |
|
||||||||
|
||||||||
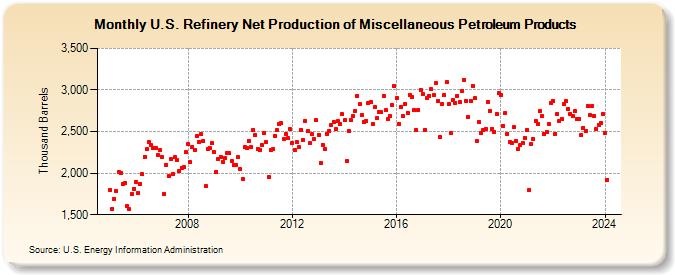
| U.S. Refinery Net Production of Miscellaneous Petroleum Products (Thousand Barrels) | ||||||||
| Year | Jan | Feb | Mar | Apr | May | Jun | Jul | Aug | Sep | Oct | Nov | Dec |
|---|---|---|---|---|---|---|---|---|---|---|---|---|
| 2005 | 1,803 | 1,571 | 1,692 | 1,788 | 2,014 | 2,004 | 1,873 | 1,884 | 1,601 | 1,568 | 1,754 | 1,814 |
| 2006 | 1,898 | 1,762 | 1,872 | 1,987 | 2,200 | 2,285 | 2,372 | 2,335 | 2,308 | 2,307 | 2,220 | 2,273 |
| 2007 | 2,195 | 1,747 | 2,100 | 1,965 | 2,166 | 1,994 | 2,188 | 2,154 | 2,025 | 2,064 | 2,068 | 2,250 |
| 2008 | 2,347 | 2,128 | 2,316 | 2,283 | 2,441 | 2,380 | 2,465 | 2,383 | 1,840 | 2,295 | 2,303 | 2,357 |
| 2009 | 2,249 | 2,018 | 2,166 | 2,196 | 2,137 | 2,180 | 2,237 | 2,238 | 2,145 | 2,095 | 2,100 | 2,188 |
| 2010 | 2,047 | 1,935 | 2,310 | 2,301 | 2,392 | 2,316 | 2,518 | 2,459 | 2,293 | 2,283 | 2,338 | 2,480 |
| 2011 | 2,369 | 1,951 | 2,273 | 2,290 | 2,451 | 2,518 | 2,587 | 2,599 | 2,405 | 2,467 | 2,419 | 2,525 |
| 2012 | 2,366 | 2,283 | 2,374 | 2,310 | 2,522 | 2,396 | 2,630 | 2,504 | 2,362 | 2,470 | 2,409 | 2,635 |
| 2013 | 2,457 | 2,120 | 2,343 | 2,290 | 2,472 | 2,509 | 2,583 | 2,614 | 2,526 | 2,622 | 2,586 | 2,706 |
| 2014 | 2,634 | 2,141 | 2,512 | 2,636 | 2,688 | 2,751 | 2,928 | 2,828 | 2,696 | 2,618 | 2,630 | 2,845 |
| 2015 | 2,855 | 2,595 | 2,792 | 2,662 | 2,739 | 2,731 | 2,930 | 2,757 | 2,645 | 2,684 | 2,816 | 3,042 |
| 2016 | 2,903 | 2,591 | 2,801 | 2,683 | 2,832 | 2,729 | 2,940 | 2,920 | 2,759 | 2,522 | 2,763 | 3,004 |
| 2017 | 2,954 | 2,522 | 2,907 | 2,932 | 3,009 | 2,934 | 3,082 | 2,871 | 2,432 | 2,832 | 2,939 | 3,091 |
| 2018 | 2,831 | 2,482 | 2,878 | 2,848 | 2,933 | 2,854 | 2,984 | 3,123 | 2,873 | 2,677 | 2,869 | 3,052 |
| 2019 | 2,899 | 2,383 | 2,613 | 2,482 | 2,519 | 2,530 | 2,859 | 2,748 | 2,536 | 2,499 | 2,710 | 2,962 |
| 2020 | 2,934 | 2,570 | 2,729 | 2,476 | 2,375 | 2,362 | 2,551 | 2,383 | 2,295 | 2,341 | 2,363 | 2,428 |
| 2021 | 2,523 | 1,798 | 2,350 | 2,416 | 2,630 | 2,591 | 2,742 | 2,689 | 2,470 | 2,489 | 2,585 | 2,840 |
| 2022 | 2,863 | 2,470 | 2,711 | 2,628 | 2,656 | 2,826 | 2,863 | 2,776 | 2,716 | 2,688 | 2,744 | 2,653 |
| 2023 | 2,656 | 2,460 | 2,547 | 2,502 | 2,809 | 2,697 | 2,810 | 2,690 | 2,531 | 2,584 | 2,602 | 2,709 |
| 2024 | 2,481 | |||||||||||
| - = No Data Reported; -- = Not Applicable; NA = Not Available; W = Withheld to avoid disclosure of individual company data. |
| Release Date: 3/29/2024 |
| Next Release Date: 4/30/2024 |