|
Download Data (XLS File) |
|
||||||||
|
||||||||
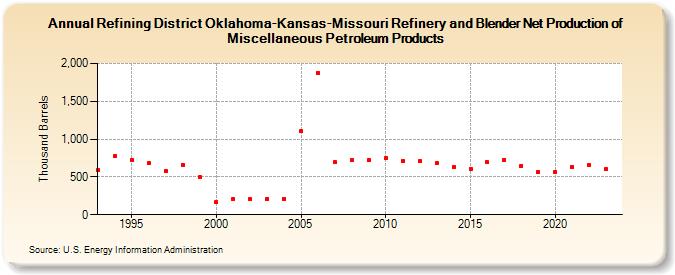
| Refining District Oklahoma-Kansas-Missouri Refinery and Blender Net Production of Miscellaneous Petroleum Products (Thousand Barrels) | ||||||||
| Decade | Year-0 | Year-1 | Year-2 | Year-3 | Year-4 | Year-5 | Year-6 | Year-7 | Year-8 | Year-9 |
|---|---|---|---|---|---|---|---|---|---|---|
| 1990's | 590 | 770 | 726 | 682 | 578 | 662 | 494 | |||
| 2000's | 170 | 207 | 202 | 213 | 213 | 1,104 | 1,879 | 693 | 717 | 722 |
| 2010's | 745 | 712 | 704 | 683 | 632 | 610 | 693 | 728 | 646 | 562 |
| 2020's | 566 | 630 | 654 | 600 |
| - = No Data Reported; -- = Not Applicable; NA = Not Available; W = Withheld to avoid disclosure of individual company data. |
| Release Date: 3/29/2024 |
| Next Release Date: 8/30/2024 |