|
Download Data (XLS File) |
|
||||||||
|
||||||||
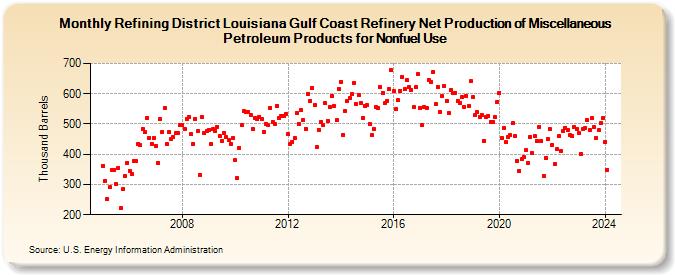
| Refining District Louisiana Gulf Coast Refinery Net Production of Miscellaneous Petroleum Products for Nonfuel Use (Thousand Barrels) | ||||||||
| Year | Jan | Feb | Mar | Apr | May | Jun | Jul | Aug | Sep | Oct | Nov | Dec |
|---|---|---|---|---|---|---|---|---|---|---|---|---|
| 2005 | 362 | 312 | 251 | 292 | 349 | 349 | 301 | 356 | 222 | 284 | 328 | 372 |
| 2006 | 346 | 334 | 377 | 376 | 435 | 430 | 484 | 472 | 521 | 454 | 435 | 454 |
| 2007 | 428 | 372 | 516 | 473 | 554 | 434 | 472 | 451 | 456 | 469 | 471 | 495 |
| 2008 | 498 | 485 | 517 | 524 | 466 | 435 | 518 | 477 | 332 | 523 | 470 | 476 |
| 2009 | 481 | 433 | 482 | 478 | 491 | 459 | 445 | 471 | 456 | 448 | 435 | 454 |
| 2010 | 380 | 320 | 422 | 496 | 542 | 538 | 541 | 530 | 485 | 519 | 515 | 524 |
| 2011 | 516 | 474 | 500 | 495 | 553 | 508 | 500 | 561 | 521 | 528 | 526 | 534 |
| 2012 | 466 | 434 | 442 | 453 | 537 | 501 | 545 | 513 | 485 | 600 | 576 | 620 |
| 2013 | 562 | 425 | 481 | 507 | 495 | 568 | 511 | 556 | 593 | 560 | 513 | 617 |
| 2014 | 640 | 465 | 543 | 576 | 586 | 599 | 637 | 567 | 596 | 570 | 520 | 561 |
| 2015 | 562 | 501 | 462 | 483 | 557 | 554 | 622 | 604 | 568 | 576 | 614 | 677 |
| 2016 | 608 | 548 | 580 | 610 | 656 | 614 | 645 | 622 | 613 | 555 | 621 | 666 |
| 2017 | 554 | 495 | 556 | 553 | 646 | 640 | 672 | 565 | 623 | 539 | 591 | 626 |
| 2018 | 577 | 537 | 613 | 601 | 604 | 577 | 570 | 589 | 557 | 592 | 559 | 641 |
| 2019 | 590 | 529 | 538 | 524 | 530 | 445 | 522 | 527 | 508 | 507 | 522 | 572 |
| 2020 | 604 | 453 | 488 | 439 | 456 | 463 | 503 | 460 | 378 | 345 | 384 | 390 |
| 2021 | 413 | 371 | 458 | 404 | 460 | 445 | 491 | 444 | 328 | 389 | 449 | 482 |
| 2022 | 431 | 367 | 416 | 460 | 411 | 478 | 488 | 479 | 463 | 461 | 490 | 482 |
| 2023 | 470 | 402 | 485 | 486 | 513 | 480 | 519 | 490 | 453 | 479 | 503 | 520 |
| 2024 | 441 | |||||||||||
| - = No Data Reported; -- = Not Applicable; NA = Not Available; W = Withheld to avoid disclosure of individual company data. |
| Release Date: 3/29/2024 |
| Next Release Date: 4/30/2024 |