|
Download Data (XLS File) |
|
||||||||
|
||||||||
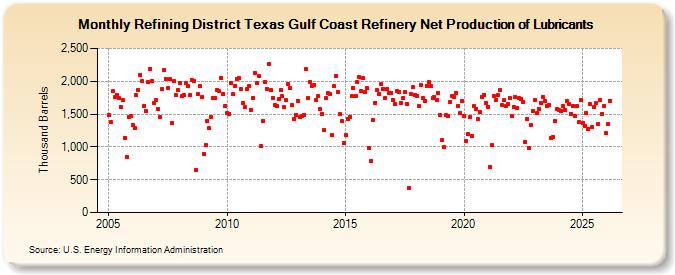
| Refining District Texas Gulf Coast Refinery Net Production of Lubricants (Thousand Barrels) | ||||||||
| Year | Jan | Feb | Mar | Apr | May | Jun | Jul | Aug | Sep | Oct | Nov | Dec |
|---|---|---|---|---|---|---|---|---|---|---|---|---|
| 2005 | 1,485 | 1,373 | 1,846 | 1,758 | 1,797 | 1,743 | 1,607 | 1,714 | 1,143 | 853 | 1,461 | 1,464 |
| 2006 | 1,327 | 1,285 | 1,784 | 1,868 | 2,100 | 1,998 | 1,627 | 1,544 | 1,981 | 2,191 | 2,004 | 1,661 |
| 2007 | 1,720 | 1,574 | 1,460 | 1,883 | 2,174 | 2,038 | 1,899 | 2,029 | 1,367 | 1,999 | 1,787 | 1,864 |
| 2008 | 1,970 | 1,773 | 1,790 | 1,972 | 1,930 | 1,786 | 2,026 | 2,011 | 655 | 1,805 | 1,925 | 1,763 |
| 2009 | 896 | 1,025 | 1,401 | 1,281 | 1,448 | 1,746 | 1,750 | 1,871 | 1,844 | 2,049 | 1,803 | 1,622 |
| 2010 | 1,515 | 1,508 | 1,972 | 1,803 | 1,934 | 2,036 | 2,047 | 1,880 | 1,666 | 1,608 | 1,877 | 1,927 |
| 2011 | 1,567 | 1,747 | 2,131 | 1,972 | 2,075 | 1,013 | 1,395 | 1,994 | 1,886 | 2,263 | 1,864 | 1,750 |
| 2012 | 1,632 | 1,622 | 1,724 | 1,859 | 1,769 | 1,600 | 1,712 | 1,958 | 1,904 | 1,638 | 1,432 | 1,491 |
| 2013 | 1,704 | 1,461 | 1,476 | 1,493 | 2,179 | 1,740 | 1,987 | 1,930 | 1,944 | 1,713 | 1,775 | 1,571 |
| 2014 | 1,506 | 1,253 | 1,737 | 1,823 | 1,812 | 1,174 | 1,921 | 2,074 | 1,840 | 1,495 | 1,398 | 1,059 |
| 2015 | 1,180 | 1,420 | 1,458 | 1,773 | 1,904 | 1,774 | 1,987 | 2,059 | 1,854 | 2,043 | 1,829 | 1,893 |
| 2016 | 986 | 790 | 1,405 | 1,676 | 1,860 | 1,798 | 1,951 | 1,883 | 1,740 | 1,885 | 1,819 | 1,827 |
| 2017 | 1,712 | 1,654 | 1,855 | 1,836 | 1,672 | 1,744 | 1,839 | 1,660 | 381 | 1,803 | 1,907 | 1,794 |
| 2018 | 1,779 | 1,617 | 1,940 | 1,742 | 1,695 | 1,934 | 1,985 | 1,925 | 1,737 | 1,764 | 1,713 | 1,821 |
| 2019 | 1,480 | 1,106 | 998 | 1,489 | 1,475 | 1,683 | 1,782 | 1,758 | 1,827 | 1,626 | 1,522 | 1,696 |
| 2020 | 1,470 | 1,095 | 1,192 | 1,455 | 1,168 | 1,618 | 1,582 | 1,420 | 1,532 | 1,757 | 1,794 | 1,673 |
| 2021 | 1,612 | 701 | 1,028 | 1,778 | 1,713 | 1,784 | 1,860 | 1,639 | 1,707 | 1,618 | 1,650 | 1,748 |
| 2022 | 1,466 | 1,615 | 1,753 | 1,597 | 1,751 | 1,727 | 1,681 | 1,077 | 1,421 | 976 | 1,326 | 1,553 |
| 2023 | 1,708 | 1,515 | 1,575 | 1,675 | 1,766 | 1,696 | 1,628 | 1,640 | 1,138 | 1,157 | 1,388 | 1,572 |
| 2024 | 1,564 | |||||||||||
| - = No Data Reported; -- = Not Applicable; NA = Not Available; W = Withheld to avoid disclosure of individual company data. |
| Release Date: 3/29/2024 |
| Next Release Date: 4/30/2024 |