|
Download Data (XLS File) |
|
||||||||
|
||||||||
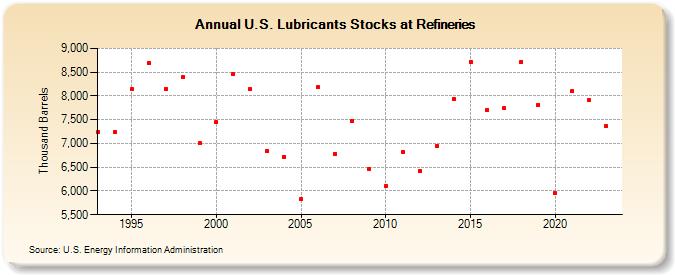
| U.S. Lubricants Stocks at Refineries (Thousand Barrels) | ||||||||
| Decade | Year-0 | Year-1 | Year-2 | Year-3 | Year-4 | Year-5 | Year-6 | Year-7 | Year-8 | Year-9 |
|---|---|---|---|---|---|---|---|---|---|---|
| 1990's | 7,233 | 7,240 | 8,138 | 8,695 | 8,154 | 8,391 | 7,004 | |||
| 2000's | 7,448 | 8,452 | 8,145 | 6,836 | 6,720 | 5,826 | 8,182 | 6,786 | 7,471 | 6,457 |
| 2010's | 6,099 | 6,828 | 6,420 | 6,943 | 7,937 | 8,723 | 7,707 | 7,739 | 8,724 | 7,814 |
| 2020's | 5,954 | 8,097 | 7,905 | 7,363 |
| - = No Data Reported; -- = Not Applicable; NA = Not Available; W = Withheld to avoid disclosure of individual company data. |
| Release Date: 3/29/2024 |
| Next Release Date: 8/30/2024 |