|
Download Data (XLS File) |
|
||||||||
|
||||||||
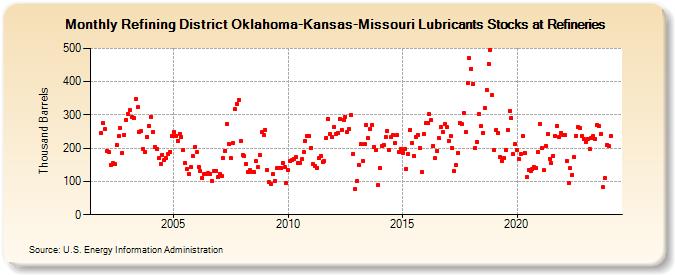
| Refining District Oklahoma-Kansas-Missouri Lubricants Stocks at Refineries (Thousand Barrels) | ||||||||
| Year | Jan | Feb | Mar | Apr | May | Jun | Jul | Aug | Sep | Oct | Nov | Dec |
|---|---|---|---|---|---|---|---|---|---|---|---|---|
| 2001 | 245 | 275 | ||||||||||
| 2002 | 257 | 193 | 188 | 150 | 154 | 151 | 210 | 236 | 262 | 185 | 241 | 286 |
| 2003 | 303 | 314 | 295 | 292 | 347 | 323 | 249 | 251 | 198 | 189 | 235 | 267 |
| 2004 | 295 | 249 | 205 | 198 | 169 | 152 | 181 | 163 | 169 | 182 | 190 | 236 |
| 2005 | 250 | 238 | 221 | 244 | 234 | 195 | 156 | 138 | 122 | 143 | 176 | 203 |
| 2006 | 189 | 143 | 131 | 111 | 123 | 123 | 125 | 123 | 102 | 131 | 132 | 113 |
| 2007 | 122 | 117 | 170 | 193 | 273 | 212 | 169 | 216 | 317 | 332 | 346 | 222 |
| 2008 | 179 | 176 | 153 | 128 | 133 | 129 | 127 | 160 | 142 | 180 | 248 | 239 |
| 2009 | 256 | 134 | 97 | 93 | 121 | 102 | 139 | 141 | 141 | 156 | 143 | 96 |
| 2010 | 135 | 160 | 165 | 168 | 172 | 156 | 155 | 166 | 190 | 222 | 238 | 237 |
| 2011 | 201 | 152 | 145 | 139 | 169 | 177 | 159 | 161 | 232 | 287 | 242 | 233 |
| 2012 | 265 | 244 | 245 | 287 | 255 | 284 | 295 | 250 | 257 | 301 | 184 | 76 |
| 2013 | 102 | 149 | 212 | 161 | 213 | 269 | 230 | 259 | 271 | 205 | 194 | 89 |
| 2014 | 141 | 206 | 211 | 234 | 252 | 196 | 233 | 239 | 217 | 240 | 190 | 198 |
| 2015 | 186 | 197 | 138 | 183 | 256 | 216 | 178 | 234 | 241 | 200 | 128 | 244 |
| 2016 | 275 | 275 | 302 | 284 | 208 | 169 | 192 | 230 | 263 | 248 | 273 | 264 |
| 2017 | 222 | 237 | 202 | 130 | 150 | 186 | 277 | 272 | 306 | 248 | 396 | 470 |
| 2018 | 439 | 394 | 200 | 218 | 303 | 266 | 247 | 321 | 376 | 454 | 496 | 359 |
| 2019 | 195 | 254 | 247 | 173 | 162 | 169 | 196 | 254 | 313 | 291 | 182 | 212 |
| 2020 | 195 | 167 | 183 | 236 | 187 | 113 | 134 | 132 | 136 | 142 | 140 | 188 |
| 2021 | 274 | 201 | 134 | 208 | 243 | 168 | 154 | 177 | 237 | 266 | 234 | 247 |
| 2022 | 241 | 239 | 162 | 95 | 139 | 120 | 174 | 238 | 264 | 260 | 237 | 227 |
| 2023 | 220 | 229 | 198 | 232 | 237 | 228 | 271 | 266 | 244 | 82 | 111 | 211 |
| 2024 | 207 | |||||||||||
| - = No Data Reported; -- = Not Applicable; NA = Not Available; W = Withheld to avoid disclosure of individual company data. |
| Release Date: 3/29/2024 |
| Next Release Date: 4/30/2024 |