|
Download Data (XLS File) |
|
||||||||
|
||||||||
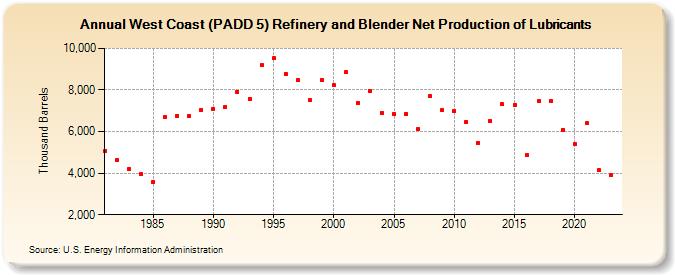
| West Coast (PADD 5) Refinery and Blender Net Production of Lubricants (Thousand Barrels) | ||||||||
| Decade | Year-0 | Year-1 | Year-2 | Year-3 | Year-4 | Year-5 | Year-6 | Year-7 | Year-8 | Year-9 |
|---|---|---|---|---|---|---|---|---|---|---|
| 1980's | 5,073 | 4,624 | 4,215 | 3,947 | 3,595 | 6,699 | 6,760 | 6,747 | 7,041 | |
| 1990's | 7,101 | 7,192 | 7,926 | 7,580 | 9,207 | 9,519 | 8,790 | 8,478 | 7,495 | 8,495 |
| 2000's | 8,224 | 8,851 | 7,378 | 7,961 | 6,908 | 6,855 | 6,863 | 6,120 | 7,719 | 7,020 |
| 2010's | 6,988 | 6,472 | 5,453 | 6,500 | 7,303 | 7,281 | 4,866 | 7,453 | 7,456 | 6,089 |
| 2020's | 5,401 | 6,399 | 4,136 | 3,913 |
| - = No Data Reported; -- = Not Applicable; NA = Not Available; W = Withheld to avoid disclosure of individual company data. |
| Release Date: 3/29/2024 |
| Next Release Date: 8/30/2024 |