|
Download Data (XLS File) |
|
||||||||
|
||||||||
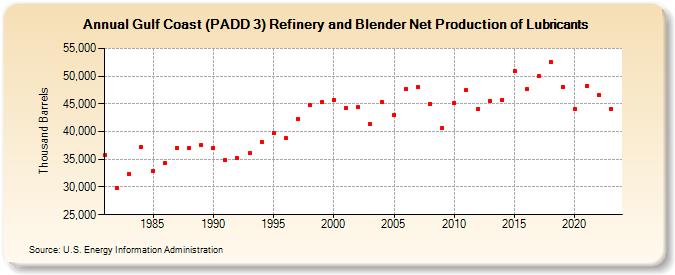
| Gulf Coast (PADD 3) Refinery and Blender Net Production of Lubricants (Thousand Barrels) | ||||||||
| Decade | Year-0 | Year-1 | Year-2 | Year-3 | Year-4 | Year-5 | Year-6 | Year-7 | Year-8 | Year-9 |
|---|---|---|---|---|---|---|---|---|---|---|
| 1980's | 35,708 | 29,802 | 32,402 | 37,253 | 32,967 | 34,338 | 37,103 | 37,018 | 37,583 | |
| 1990's | 37,044 | 34,881 | 35,168 | 36,119 | 38,189 | 39,654 | 38,805 | 42,345 | 44,736 | 45,332 |
| 2000's | 45,774 | 44,255 | 44,400 | 41,368 | 45,318 | 43,010 | 47,757 | 48,006 | 45,040 | 40,676 |
| 2010's | 45,221 | 47,489 | 44,043 | 45,506 | 45,755 | 50,921 | 47,626 | 49,938 | 52,598 | 48,048 |
| 2020's | 44,006 | 48,202 | 46,568 | 44,120 |
| - = No Data Reported; -- = Not Applicable; NA = Not Available; W = Withheld to avoid disclosure of individual company data. |
| Release Date: 4/30/2024 |
| Next Release Date: 8/30/2024 |