|
Download Data (XLS File) |
|
||||||||
|
||||||||
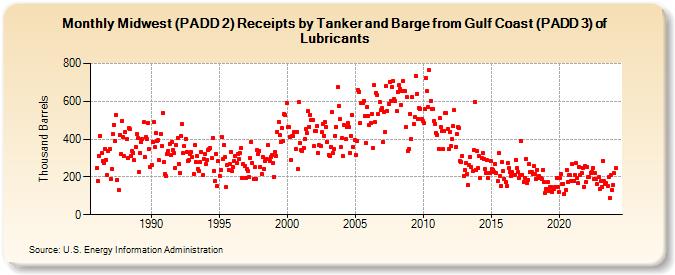
| Midwest (PADD 2) Receipts by Tanker and Barge from Gulf Coast (PADD 3) of Lubricants (Thousand Barrels) | ||||||||
| Year | Jan | Feb | Mar | Apr | May | Jun | Jul | Aug | Sep | Oct | Nov | Dec |
|---|---|---|---|---|---|---|---|---|---|---|---|---|
| 1986 | 249 | 178 | 311 | 419 | 325 | 283 | 272 | 350 | 291 | 209 | 338 | 345 |
| 1987 | 190 | 243 | 428 | 476 | 391 | 530 | 183 | 130 | 424 | 320 | 498 | 411 |
| 1988 | 309 | 438 | 401 | 298 | 457 | 451 | 308 | 336 | 329 | 287 | 359 | 426 |
| 1989 | 404 | 227 | 328 | 383 | 399 | 488 | 306 | 410 | 399 | 484 | 346 | 253 |
| 1990 | 263 | 385 | 490 | 358 | 431 | 392 | 394 | 287 | 428 | 364 | 539 | 278 |
| 1991 | 215 | 206 | 319 | 338 | 376 | 316 | 384 | 343 | 327 | 249 | 369 | 406 |
| 1992 | 269 | 223 | 415 | 478 | 324 | 362 | 402 | 334 | 286 | 292 | 322 | 331 |
| 1993 | 303 | 215 | 367 | 280 | 311 | 242 | 231 | 277 | 331 | 208 | 296 | 322 |
| 1994 | 269 | 292 | 342 | 347 | 352 | 300 | 408 | 232 | 177 | 323 | 150 | 284 |
| 1995 | 205 | 239 | 410 | 295 | 370 | 303 | 147 | 263 | 237 | 266 | 334 | 231 |
| 1996 | 250 | 285 | 309 | 273 | 319 | 294 | 325 | 353 | 192 | 267 | 259 | 195 |
| 1997 | 244 | 233 | 199 | 302 | 385 | 273 | 190 | 251 | 191 | 342 | 319 | 339 |
| 1998 | 254 | 217 | 307 | 242 | 284 | 293 | 293 | 368 | 285 | 307 | 315 | 275 |
| 1999 | 202 | 332 | 312 | 439 | 493 | 420 | 385 | 458 | 390 | 533 | 525 | 591 |
| 2000 | 462 | 463 | 413 | 291 | 415 | 416 | 439 | 350 | 439 | 240 | 597 | 378 |
| 2001 | 343 | 336 | 355 | 398 | 452 | 430 | 547 | 466 | 529 | 503 | 503 | 362 |
| 2002 | 442 | 444 | 470 | 329 | 367 | 362 | 436 | 481 | 418 | 490 | 465 | 387 |
| 2003 | 315 | 309 | 357 | 543 | 326 | 346 | 418 | 464 | 674 | 576 | 504 | 358 |
| 2004 | 405 | 308 | 473 | 398 | 465 | 486 | 462 | 328 | 418 | 527 | 360 | 393 |
| 2005 | 316 | 392 | 659 | 651 | 485 | 591 | 592 | 603 | 520 | 379 | 571 | 523 |
| 2006 | 475 | 485 | 533 | 355 | 684 | 490 | 643 | 631 | 532 | 598 | 552 | 562 |
| 2007 | 384 | 545 | 438 | 680 | 551 | 586 | 703 | 601 | 673 | 707 | 612 | 599 |
| 2008 | 548 | 651 | 684 | 667 | 583 | 657 | 705 | 653 | 465 | 621 | 337 | 346 |
| 2009 | 534 | 399 | 622 | 482 | 516 | 735 | 641 | 506 | 566 | 561 | 508 | 496 |
| 2010 | 486 | 561 | 723 | 653 | 570 | 763 | 601 | 560 | 559 | 497 | 482 | 430 |
| 2011 | 422 | 347 | 511 | 463 | 442 | 345 | 443 | 537 | 538 | 455 | 347 | 440 |
| 2012 | 363 | 401 | 468 | 552 | 357 | 426 | 462 | 460 | 286 | 280 | 311 | 205 |
| 2013 | 236 | 273 | 214 | 155 | 262 | 306 | 254 | 232 | 341 | 598 | 237 | 335 |
| 2014 | 245 | 309 | 195 | 298 | 326 | 293 | 240 | 221 | 287 | 194 | 222 | 286 |
| 2015 | 241 | 239 | 228 | 269 | 220 | 178 | 325 | 206 | 153 | 278 | 231 | 191 |
| 2016 | 172 | 150 | 272 | 246 | 228 | 206 | 224 | 212 | 210 | 291 | 245 | 224 |
| 2017 | 196 | 212 | 392 | 212 | 173 | 196 | 295 | 167 | 186 | 268 | 228 | 228 |
| 2018 | 215 | 258 | 217 | 189 | 238 | 195 | 203 | 193 | 187 | 238 | 171 | 115 |
| 2019 | 138 | 173 | 128 | 145 | 149 | 118 | 140 | 134 | 146 | 195 | 146 | 122 |
| 2020 | 193 | 218 | 162 | 164 | 112 | 130 | 238 | 173 | 208 | 210 | 177 | 266 |
| 2021 | 180 | 209 | 271 | 196 | 166 | 255 | 212 | 222 | 249 | 149 | 257 | 172 |
| 2022 | 254 | 202 | 198 | 222 | 228 | 248 | 190 | 220 | 189 | 161 | 198 | 134 |
| 2023 | 177 | 148 | 286 | 176 | 164 | 166 | 152 | 200 | 90 | 208 | 130 | 159 |
| 2024 | 219 | 245 | ||||||||||
| - = No Data Reported; -- = Not Applicable; NA = Not Available; W = Withheld to avoid disclosure of individual company data. |
| Release Date: 4/30/2024 |
| Next Release Date: 5/31/2024 |