|
Download Data (XLS File) |
|
||||||||
|
||||||||
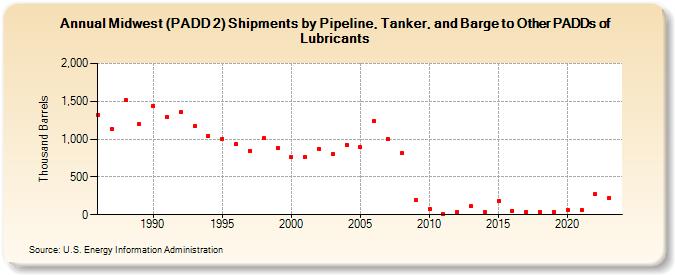
| Midwest (PADD 2) Shipments by Pipeline, Tanker, and Barge to Other PADDs of Lubricants (Thousand Barrels) | ||||||||
| Decade | Year-0 | Year-1 | Year-2 | Year-3 | Year-4 | Year-5 | Year-6 | Year-7 | Year-8 | Year-9 |
|---|---|---|---|---|---|---|---|---|---|---|
| 1980's | 1,325 | 1,130 | 1,511 | 1,195 | ||||||
| 1990's | 1,442 | 1,291 | 1,353 | 1,168 | 1,046 | 1,006 | 929 | 846 | 1,011 | 886 |
| 2000's | 759 | 761 | 870 | 804 | 927 | 892 | 1,235 | 1,003 | 811 | 188 |
| 2010's | 70 | 9 | 31 | 109 | 34 | 185 | 53 | 41 | 40 | 40 |
| 2020's | 60 | 68 | 269 | 226 |
| - = No Data Reported; -- = Not Applicable; NA = Not Available; W = Withheld to avoid disclosure of individual company data. |
| Release Date: 3/29/2024 |
| Next Release Date: 8/30/2024 |