|
Download Data (XLS File) |
|
||||||||
|
||||||||
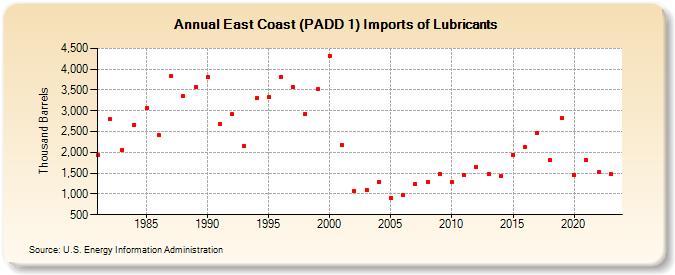
| East Coast (PADD 1) Imports of Lubricants (Thousand Barrels) | ||||||||
| Decade | Year-0 | Year-1 | Year-2 | Year-3 | Year-4 | Year-5 | Year-6 | Year-7 | Year-8 | Year-9 |
|---|---|---|---|---|---|---|---|---|---|---|
| 1980's | 1,940 | 2,795 | 2,059 | 2,667 | 3,069 | 2,411 | 3,825 | 3,358 | 3,570 | |
| 1990's | 3,816 | 2,693 | 2,922 | 2,156 | 3,306 | 3,321 | 3,821 | 3,563 | 2,917 | 3,516 |
| 2000's | 4,323 | 2,184 | 1,065 | 1,106 | 1,290 | 911 | 970 | 1,237 | 1,294 | 1,481 |
| 2010's | 1,275 | 1,444 | 1,654 | 1,481 | 1,431 | 1,942 | 2,140 | 2,467 | 1,815 | 2,826 |
| 2020's | 1,463 | 1,816 | 1,525 | 1,474 |
| - = No Data Reported; -- = Not Applicable; NA = Not Available; W = Withheld to avoid disclosure of individual company data. |
| Release Date: 8/30/2024 |
| Next Release Date: 8/29/2025 |