|
Download Data (XLS File) |
|
||||||||
|
||||||||
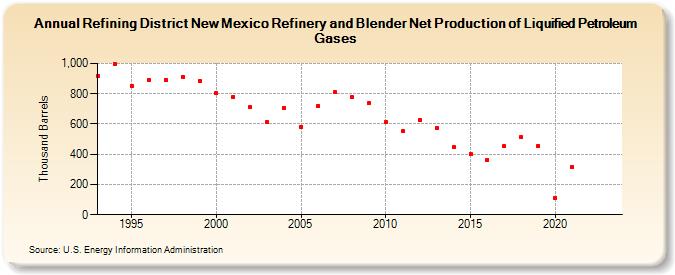
| Refining District New Mexico Refinery and Blender Net Production of Liquified Petroleum Gases (Thousand Barrels) | ||||||||
| Decade | Year-0 | Year-1 | Year-2 | Year-3 | Year-4 | Year-5 | Year-6 | Year-7 | Year-8 | Year-9 |
|---|---|---|---|---|---|---|---|---|---|---|
| 1990's | 920 | 998 | 853 | 891 | 893 | 910 | 885 | |||
| 2000's | 806 | 778 | 710 | 611 | 706 | 583 | 722 | 809 | 777 | 737 |
| 2010's | 613 | 553 | 627 | 573 | 446 | 401 | 365 | 453 | 511 | 457 |
| 2020's | 113 | 315 | -- | -- |
| - = No Data Reported; -- = Not Applicable; NA = Not Available; W = Withheld to avoid disclosure of individual company data. |
| Release Date: 8/30/2024 |
| Next Release Date: 8/29/2025 |