|
Download Data (XLS File) |
|
||||||||
|
||||||||
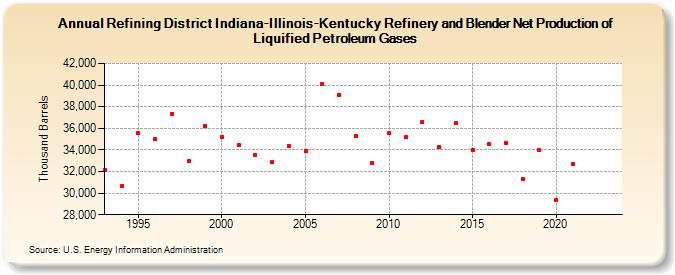
| Refining District Indiana-Illinois-Kentucky Refinery and Blender Net Production of Liquified Petroleum Gases (Thousand Barrels) | ||||||||
| Decade | Year-0 | Year-1 | Year-2 | Year-3 | Year-4 | Year-5 | Year-6 | Year-7 | Year-8 | Year-9 |
|---|---|---|---|---|---|---|---|---|---|---|
| 1990's | 32,126 | 30,644 | 35,529 | 34,971 | 37,285 | 32,932 | 36,181 | |||
| 2000's | 35,210 | 34,467 | 33,540 | 32,865 | 34,361 | 33,928 | 40,103 | 39,062 | 35,304 | 32,816 |
| 2010's | 35,534 | 35,186 | 36,609 | 34,258 | 36,475 | 33,983 | 34,559 | 34,622 | 31,297 | 33,946 |
| 2020's | 29,343 | 32,732 | -- | -- |
| - = No Data Reported; -- = Not Applicable; NA = Not Available; W = Withheld to avoid disclosure of individual company data. |
| Release Date: 3/29/2024 |
| Next Release Date: 8/30/2024 |