|
Download Data (XLS File) |
|
||||||||
|
||||||||
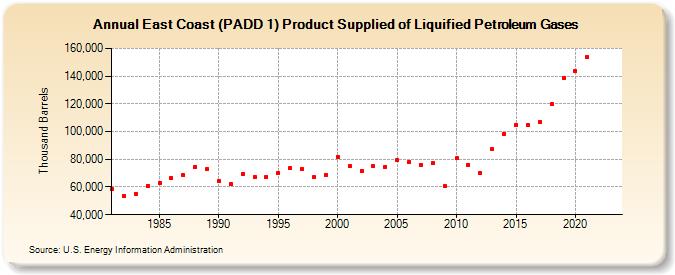
| East Coast (PADD 1) Product Supplied of Liquified Petroleum Gases (Thousand Barrels) | ||||||||
| Decade | Year-0 | Year-1 | Year-2 | Year-3 | Year-4 | Year-5 | Year-6 | Year-7 | Year-8 | Year-9 |
|---|---|---|---|---|---|---|---|---|---|---|
| 1980's | 58,279 | 53,327 | 55,198 | 60,906 | 63,141 | 66,820 | 68,545 | 74,771 | 73,154 | |
| 1990's | 64,039 | 62,055 | 69,515 | 67,387 | 67,374 | 70,314 | 73,726 | 73,214 | 66,956 | 68,902 |
| 2000's | 81,860 | 75,048 | 71,770 | 74,828 | 74,764 | 79,122 | 77,945 | 76,105 | 76,970 | 60,538 |
| 2010's | 80,630 | 76,140 | 70,455 | 87,155 | 98,367 | 104,771 | 104,504 | 107,111 | 119,627 | 138,772 |
| 2020's | 143,764 | 153,724 | -- | -- |
| - = No Data Reported; -- = Not Applicable; NA = Not Available; W = Withheld to avoid disclosure of individual company data. |
| Release Date: 3/29/2024 |
| Next Release Date: 8/30/2024 |