|
Download Data (XLS File) |
|
||||||||
|
||||||||
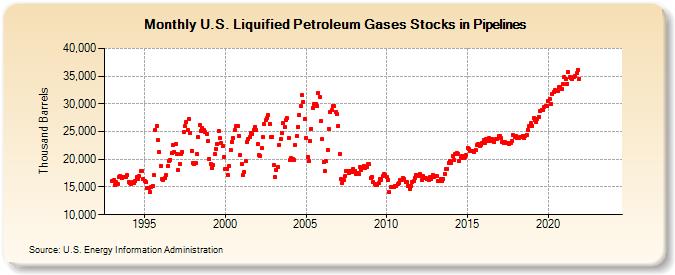
| U.S. Liquified Petroleum Gases Stocks in Pipelines (Thousand Barrels) | ||||||||
| Year | Jan | Feb | Mar | Apr | May | Jun | Jul | Aug | Sep | Oct | Nov | Dec |
|---|---|---|---|---|---|---|---|---|---|---|---|---|
| 1993 | 16,123 | 16,209 | 15,339 | 15,835 | 15,549 | 16,851 | 16,944 | 16,611 | 16,846 | 16,849 | 16,802 | 17,116 |
| 1994 | 15,942 | 15,768 | 15,497 | 15,908 | 15,682 | 16,066 | 16,743 | 16,390 | 16,915 | 17,910 | 17,849 | 16,506 |
| 1995 | 16,116 | 15,836 | 14,861 | 14,811 | 14,028 | 15,057 | 15,241 | 17,100 | 25,325 | 26,021 | 23,398 | 21,289 |
| 1996 | 18,820 | 16,441 | 16,335 | 16,566 | 17,090 | 18,775 | 19,750 | 19,926 | 21,066 | 22,577 | 21,359 | 22,687 |
| 1997 | 20,934 | 18,073 | 19,113 | 20,880 | 21,361 | 24,895 | 25,978 | 26,646 | 25,226 | 27,310 | 24,819 | 21,556 |
| 1998 | 19,243 | 19,068 | 19,275 | 20,986 | 23,999 | 26,198 | 25,112 | 25,614 | 25,271 | 24,914 | 24,558 | 23,278 |
| 1999 | 20,092 | 19,113 | 18,441 | 18,944 | 20,895 | 21,907 | 22,780 | 25,179 | 23,778 | 22,909 | 22,340 | 20,485 |
| 2000 | 18,282 | 18,273 | 17,096 | 18,769 | 21,751 | 23,168 | 23,854 | 25,244 | 26,064 | 26,052 | 24,279 | 20,849 |
| 2001 | 19,132 | 17,235 | 17,742 | 19,655 | 23,093 | 23,737 | 23,975 | 24,723 | 24,648 | 25,320 | 25,848 | 25,256 |
| 2002 | 22,693 | 20,851 | 20,652 | 21,995 | 24,057 | 26,313 | 27,016 | 27,520 | 27,919 | 26,432 | 23,947 | 24,026 |
| 2003 | 18,900 | 16,760 | 17,980 | 18,631 | 22,601 | 23,586 | 24,817 | 26,581 | 25,834 | 27,087 | 27,390 | 23,860 |
| 2004 | 19,872 | 20,148 | 20,009 | 19,878 | 22,604 | 24,135 | 25,858 | 27,957 | 29,550 | 31,528 | 30,420 | 27,258 |
| 2005 | 23,846 | 20,433 | 19,655 | 23,339 | 25,513 | 29,288 | 30,032 | 30,048 | 29,623 | 32,004 | 31,303 | 26,904 |
| 2006 | 23,589 | 19,565 | 17,872 | 19,602 | 21,718 | 25,504 | 28,557 | 28,836 | 29,625 | 29,536 | 28,526 | 28,084 |
| 2007 | 26,043 | 20,951 | 16,379 | 15,729 | 16,238 | 16,896 | 17,800 | 17,936 | 17,523 | 17,940 | 17,789 | 18,297 |
| 2008 | 17,869 | 17,419 | 17,609 | 17,272 | 18,615 | 18,075 | 18,474 | 18,805 | 18,414 | 18,660 | 19,141 | 19,063 |
| 2009 | 16,617 | 16,890 | 15,880 | 15,602 | 15,406 | 15,355 | 15,735 | 16,354 | 16,351 | 17,000 | 17,324 | 17,138 |
| 2010 | 16,739 | 16,324 | 14,040 | 14,963 | 15,081 | 15,042 | 15,159 | 15,211 | 15,498 | 15,806 | 16,323 | 16,317 |
| 2011 | 16,693 | 16,424 | 15,828 | 15,860 | 15,179 | 14,658 | 15,195 | 15,845 | 16,001 | 16,663 | 17,160 | 17,097 |
| 2012 | 16,922 | 17,258 | 16,245 | 16,949 | 16,575 | 16,539 | 16,365 | 16,310 | 16,736 | 16,420 | 17,230 | 16,833 |
| 2013 | 16,910 | 16,990 | 16,132 | 16,066 | 16,433 | 16,138 | 16,434 | 17,424 | 18,221 | 18,305 | 19,340 | 19,648 |
| 2014 | 19,368 | 20,588 | 19,956 | 20,877 | 21,211 | 21,005 | 19,762 | 20,250 | 20,667 | 20,175 | 20,440 | 20,723 |
| 2015 | 22,103 | 21,861 | 21,423 | 21,496 | 21,564 | 21,346 | 21,619 | 22,517 | 22,790 | 22,353 | 22,596 | 22,952 |
| 2016 | 23,429 | 22,957 | 23,638 | 23,360 | 23,757 | 23,224 | 23,642 | 23,358 | 23,037 | 23,599 | 23,706 | 24,184 |
| 2017 | 24,284 | 23,759 | 23,062 | 22,916 | 23,069 | 22,944 | 22,962 | 22,821 | 22,948 | 23,315 | 24,344 | 24,041 |
| 2018 | 24,272 | 23,777 | 23,766 | 23,979 | 24,107 | 24,180 | 23,749 | 24,206 | 24,392 | 25,252 | 25,968 | 26,463 |
| 2019 | 26,077 | 27,438 | 27,028 | 26,647 | 27,222 | 27,689 | 28,651 | 28,916 | 28,815 | 29,426 | 29,628 | 29,538 |
| 2020 | 30,546 | 30,813 | 30,031 | 31,782 | 32,167 | 32,482 | 32,360 | 32,383 | 32,963 | 32,973 | 32,749 | 33,568 |
| 2021 | 34,835 | 34,501 | 33,667 | 35,685 | 34,845 | 34,684 | 34,432 | 34,772 | 35,002 | 35,507 | 36,158 | 34,524 |
| 2022 | -- | -- | -- | -- | -- | -- | -- | -- | -- | -- | -- | -- |
| 2023 | -- | -- | -- | -- | -- | -- | -- | -- | -- | -- | -- | -- |
| 2024 | -- | |||||||||||
| - = No Data Reported; -- = Not Applicable; NA = Not Available; W = Withheld to avoid disclosure of individual company data. |
| Release Date: 3/29/2024 |
| Next Release Date: 4/30/2024 |