|
Download Data (XLS File) |
|
||||||||
|
||||||||
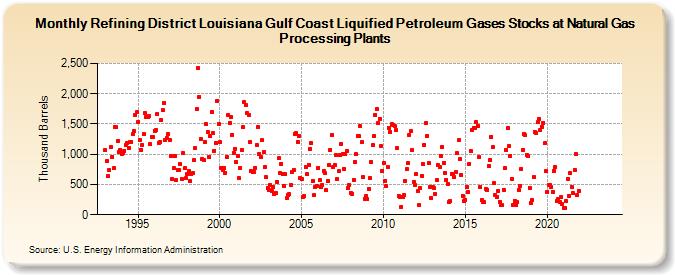
| Refining District Louisiana Gulf Coast Liquified Petroleum Gases Stocks at Natural Gas Processing Plants (Thousand Barrels) | ||||||||
| Year | Jan | Feb | Mar | Apr | May | Jun | Jul | Aug | Sep | Oct | Nov | Dec |
|---|---|---|---|---|---|---|---|---|---|---|---|---|
| 1993 | 1,063 | 884 | 644 | 736 | 1,120 | 961 | 765 | 1,447 | 1,445 | 1,221 | 1,041 | 1,077 |
| 1994 | 1,009 | 1,016 | 1,060 | 1,156 | 1,180 | 1,110 | 1,201 | 1,209 | 1,334 | 1,383 | 1,652 | 1,693 |
| 1995 | 1,535 | 1,228 | 1,075 | 1,156 | 1,330 | 1,679 | 1,622 | 1,621 | 1,627 | 1,162 | 1,292 | 1,281 |
| 1996 | 1,388 | 1,393 | 1,663 | 1,180 | 1,206 | 1,564 | 1,725 | 1,853 | 1,237 | 1,271 | 1,328 | 1,242 |
| 1997 | 964 | 587 | 771 | 976 | 568 | 745 | 738 | 834 | 587 | 1,020 | 766 | 604 |
| 1998 | 672 | 715 | 551 | 668 | 685 | 908 | 1,102 | 1,744 | 2,424 | 1,950 | 1,246 | 928 |
| 1999 | 909 | 1,202 | 1,496 | 1,364 | 951 | 1,302 | 1,699 | 1,345 | 1,058 | 1,192 | 1,884 | 1,506 |
| 2000 | 1,196 | 772 | 737 | 769 | 697 | 956 | 1,655 | 1,522 | 1,609 | 1,324 | 1,026 | 1,087 |
| 2001 | 874 | 972 | 602 | 769 | 1,069 | 1,445 | 1,859 | 1,810 | 1,680 | 1,656 | 1,205 | 721 |
| 2002 | 701 | 707 | 777 | 1,154 | 1,454 | 1,007 | 962 | 1,234 | 1,035 | 787 | 618 | 447 |
| 2003 | 413 | 486 | 385 | 463 | 336 | 359 | 547 | 932 | 693 | 843 | 673 | 479 |
| 2004 | 665 | 272 | 325 | 336 | 494 | 703 | 743 | 1,338 | 1,344 | 1,202 | 1,305 | 608 |
| 2005 | 589 | 293 | 315 | 787 | 665 | 825 | 1,093 | 1,184 | 561 | 321 | 457 | 473 |
| 2006 | 779 | 572 | 462 | 497 | 723 | 682 | 408 | 558 | 819 | 1,071 | 1,321 | 787 |
| 2007 | 822 | 985 | 591 | 715 | 987 | 1,175 | 1,001 | 760 | 1,004 | 1,054 | 434 | 492 |
| 2008 | 364 | 350 | 577 | 875 | 999 | 1,303 | 1,293 | 1,459 | 1,199 | 616 | 265 | 311 |
| 2009 | 256 | 432 | 599 | 869 | 1,145 | 1,305 | 1,653 | 1,740 | 1,511 | 1,590 | 1,129 | 730 |
| 2010 | 863 | 563 | 474 | 790 | 1,439 | 1,360 | 1,495 | 1,477 | 1,465 | 1,393 | 1,098 | 310 |
| 2011 | 293 | 132 | 298 | 323 | 558 | 754 | 858 | 1,320 | 1,376 | 1,065 | 541 | 499 |
| 2012 | 681 | 387 | 153 | 437 | 647 | 834 | 1,155 | 1,509 | 1,304 | 858 | 465 | 279 |
| 2013 | 459 | 444 | 339 | 571 | 817 | 793 | 973 | 1,122 | 863 | 695 | 578 | 504 |
| 2014 | 209 | 224 | 679 | 676 | 621 | 701 | 1,013 | 1,227 | 916 | 663 | 314 | 228 |
| 2015 | 251 | 466 | 379 | 845 | 1,047 | 1,408 | 1,439 | 1,433 | 1,527 | 1,472 | 953 | 463 |
| 2016 | 251 | 203 | 204 | 427 | 414 | 808 | 912 | 1,292 | 1,119 | 518 | 322 | 294 |
| 2017 | 397 | 215 | 154 | 156 | 414 | 771 | 1,066 | 1,430 | 1,132 | 970 | 594 | 155 |
| 2018 | 232 | 156 | 204 | 408 | 479 | 757 | 1,069 | 1,337 | 1,310 | 994 | 969 | 447 |
| 2019 | 196 | 241 | 623 | 1,365 | 1,345 | 1,527 | 1,590 | 1,402 | 1,457 | 1,524 | 1,179 | 718 |
| 2020 | 376 | 488 | 495 | 460 | 382 | 727 | 782 | 228 | 268 | 212 | 292 | 170 |
| 2021 | 112 | 112 | 226 | 592 | 315 | 683 | 462 | 352 | 742 | 1,002 | 334 | 400 |
| 2022 | -- | -- | -- | -- | -- | -- | -- | -- | -- | -- | -- | -- |
| 2023 | -- | -- | -- | -- | -- | -- | -- | -- | -- | -- | -- | -- |
| 2024 | -- | |||||||||||
| - = No Data Reported; -- = Not Applicable; NA = Not Available; W = Withheld to avoid disclosure of individual company data. |
| Release Date: 3/29/2024 |
| Next Release Date: 4/30/2024 |