|
Download Data (XLS File) |
|
||||||||
|
||||||||
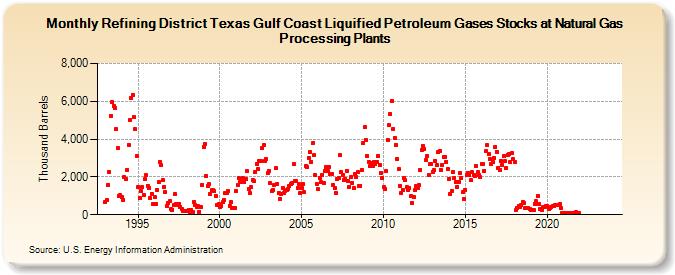
| Refining District Texas Gulf Coast Liquified Petroleum Gases Stocks at Natural Gas Processing Plants (Thousand Barrels) | ||||||||
| Year | Jan | Feb | Mar | Apr | May | Jun | Jul | Aug | Sep | Oct | Nov | Dec |
|---|---|---|---|---|---|---|---|---|---|---|---|---|
| 1993 | 650 | 752 | 1,596 | 2,279 | 5,246 | 5,944 | 5,767 | 5,662 | 4,519 | 3,511 | 1,007 | 1,026 |
| 1994 | 915 | 793 | 1,974 | 1,891 | 2,387 | 3,688 | 5,033 | 6,171 | 6,358 | 5,164 | 4,510 | 3,099 |
| 1995 | 1,466 | 860 | 1,247 | 1,448 | 1,032 | 1,875 | 2,076 | 1,537 | 1,404 | 866 | 1,113 | 556 |
| 1996 | 963 | 571 | 1,326 | 1,730 | 2,798 | 2,613 | 1,840 | 1,470 | 1,176 | 468 | 622 | 712 |
| 1997 | 281 | 273 | 491 | 1,095 | 577 | 530 | 561 | 432 | 290 | 178 | 198 | 220 |
| 1998 | 213 | 264 | 112 | 252 | 130 | 685 | 524 | 413 | 439 | 170 | 384 | 1,595 |
| 1999 | 3,583 | 3,734 | 2,054 | 1,528 | 1,599 | 1,112 | 1,283 | 1,293 | 1,229 | 999 | 528 | 574 |
| 2000 | 433 | 435 | 647 | 804 | 1,143 | 1,152 | 1,241 | 462 | 653 | 356 | 340 | 361 |
| 2001 | 1,246 | 1,551 | 1,926 | 1,729 | 1,875 | 1,916 | 1,710 | 1,871 | 2,297 | 1,358 | 1,148 | 1,444 |
| 2002 | 1,838 | 1,766 | 2,240 | 2,674 | 2,413 | 2,835 | 2,817 | 3,519 | 3,684 | 2,863 | 2,935 | 2,196 |
| 2003 | 2,304 | 1,656 | 1,232 | 1,318 | 1,576 | 2,449 | 1,649 | 1,148 | 851 | 1,100 | 1,433 | 1,165 |
| 2004 | 1,246 | 1,309 | 1,377 | 1,544 | 1,624 | 1,658 | 2,666 | 1,769 | 1,782 | 1,401 | 1,637 | 1,134 |
| 2005 | 1,427 | 1,616 | 1,186 | 2,598 | 2,523 | 3,011 | 3,326 | 2,811 | 3,778 | 3,143 | 2,089 | 1,616 |
| 2006 | 1,335 | 1,918 | 1,725 | 2,114 | 1,698 | 2,302 | 2,508 | 2,333 | 2,523 | 2,129 | 2,173 | 1,570 |
| 2007 | 1,395 | 1,163 | 1,864 | 1,941 | 3,134 | 2,251 | 2,116 | 1,814 | 1,899 | 2,334 | 1,762 | 1,464 |
| 2008 | 1,990 | 1,691 | 1,393 | 2,157 | 2,009 | 2,259 | 1,522 | 1,533 | 2,386 | 3,769 | 4,617 | 3,947 |
| 2009 | 3,096 | 2,801 | 2,557 | 2,728 | 2,597 | 2,793 | 2,703 | 2,807 | 3,130 | 2,620 | 2,214 | 1,947 |
| 2010 | 1,473 | 1,379 | 2,294 | 3,946 | 4,724 | 5,316 | 6,022 | 4,543 | 4,058 | 3,690 | 2,961 | 2,397 |
| 2011 | 1,521 | 1,163 | 1,292 | 1,930 | 1,823 | 1,448 | 1,325 | 1,404 | 987 | 634 | 911 | 1,293 |
| 2012 | 1,535 | 1,429 | 1,552 | 2,391 | 3,425 | 3,644 | 3,498 | 2,907 | 3,132 | 2,121 | 2,662 | 2,668 |
| 2013 | 2,282 | 2,351 | 2,852 | 2,642 | 3,295 | 3,384 | 2,378 | 2,638 | 3,053 | 3,065 | 2,804 | 2,425 |
| 2014 | 1,902 | 1,104 | 1,272 | 2,240 | 1,952 | 1,720 | 1,485 | 1,726 | 2,200 | 1,930 | 1,178 | 816 |
| 2015 | 1,299 | 2,095 | 2,213 | 2,081 | 1,818 | 2,236 | 2,124 | 2,043 | 2,588 | 2,235 | 2,111 | 1,981 |
| 2016 | 2,691 | 2,660 | 2,320 | 3,353 | 3,668 | 3,201 | 2,947 | 2,680 | 2,785 | 3,013 | 3,583 | 3,334 |
| 2017 | 2,489 | 2,348 | 2,863 | 2,645 | 3,096 | 2,820 | 2,463 | 3,168 | 3,199 | 2,794 | 3,275 | 2,922 |
| 2018 | 2,791 | 229 | 374 | 484 | 411 | 525 | 664 | 619 | 336 | 333 | 333 | 326 |
| 2019 | 262 | 274 | 235 | 584 | 706 | 993 | 555 | 318 | 273 | 421 | 391 | 460 |
| 2020 | 465 | 305 | 337 | 396 | 475 | 449 | 508 | 512 | 494 | 549 | 350 | 97 |
| 2021 | 91 | 94 | 98 | 100 | 83 | 97 | 95 | 101 | 99 | 127 | 93 | 98 |
| 2022 | -- | -- | -- | -- | -- | -- | -- | -- | -- | -- | -- | -- |
| 2023 | -- | -- | -- | -- | -- | -- | -- | -- | -- | -- | -- | -- |
| 2024 | -- | |||||||||||
| - = No Data Reported; -- = Not Applicable; NA = Not Available; W = Withheld to avoid disclosure of individual company data. |
| Release Date: 3/29/2024 |
| Next Release Date: 4/30/2024 |