|
Download Data (XLS File) |
|
||||||||
|
||||||||
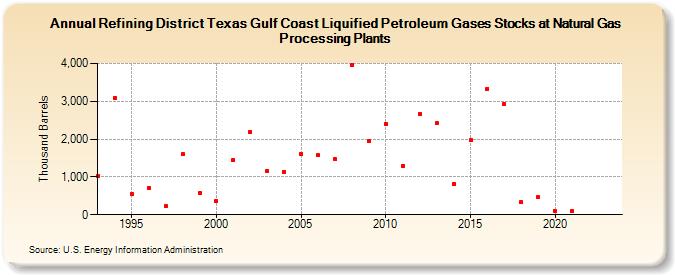
| Refining District Texas Gulf Coast Liquified Petroleum Gases Stocks at Natural Gas Processing Plants (Thousand Barrels) | ||||||||
| Decade | Year-0 | Year-1 | Year-2 | Year-3 | Year-4 | Year-5 | Year-6 | Year-7 | Year-8 | Year-9 |
|---|---|---|---|---|---|---|---|---|---|---|
| 1990's | 1,026 | 3,099 | 556 | 712 | 220 | 1,595 | 574 | |||
| 2000's | 361 | 1,444 | 2,196 | 1,165 | 1,134 | 1,616 | 1,570 | 1,464 | 3,947 | 1,947 |
| 2010's | 2,397 | 1,293 | 2,668 | 2,425 | 816 | 1,981 | 3,334 | 2,922 | 326 | 460 |
| 2020's | 97 | 98 | -- | -- |
| - = No Data Reported; -- = Not Applicable; NA = Not Available; W = Withheld to avoid disclosure of individual company data. |
| Release Date: 3/29/2024 |
| Next Release Date: 8/30/2024 |