|
Download Data (XLS File) |
|
||||||||
|
||||||||
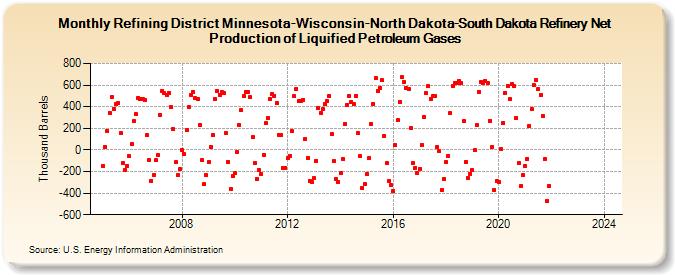
| Refining District Minnesota-Wisconsin-North Dakota-South Dakota Refinery Net Production of Liquified Petroleum Gases (Thousand Barrels) | ||||||||
| Year | Jan | Feb | Mar | Apr | May | Jun | Jul | Aug | Sep | Oct | Nov | Dec |
|---|---|---|---|---|---|---|---|---|---|---|---|---|
| 2005 | -149 | 30 | 178 | 345 | 492 | 381 | 422 | 432 | 157 | -117 | -184 | -147 |
| 2006 | -59 | 53 | 263 | 331 | 485 | 471 | 467 | 459 | 134 | -91 | -287 | -229 |
| 2007 | -97 | -48 | 325 | 549 | 524 | 506 | 528 | 395 | 189 | -115 | -232 | -181 |
| 2008 | -2 | -39 | 181 | 395 | 506 | 538 | 479 | 474 | 227 | -95 | -320 | -235 |
| 2009 | -112 | 27 | 137 | 468 | 548 | 511 | 534 | 526 | 158 | -111 | -366 | -243 |
| 2010 | -217 | -20 | 227 | 371 | 498 | 535 | 538 | 489 | 116 | -119 | -265 | -184 |
| 2011 | -223 | -43 | 246 | 298 | 472 | 515 | 502 | 433 | 138 | 137 | -165 | -163 |
| 2012 | -77 | -55 | 176 | 495 | 566 | 451 | 455 | 463 | 103 | -73 | -286 | -299 |
| 2013 | -264 | -99 | 387 | 342 | 375 | 427 | 452 | 499 | 146 | -105 | -273 | -296 |
| 2014 | -217 | -83 | 239 | 418 | 499 | 444 | 424 | 503 | 156 | -60 | -355 | -317 |
| 2015 | -225 | -75 | 238 | 429 | 662 | 545 | 577 | 643 | 128 | -122 | -284 | -325 |
| 2016 | -384 | 41 | 273 | 446 | 672 | 625 | 572 | 566 | 199 | -125 | -164 | -214 |
| 2017 | -174 | 48 | 306 | 524 | 587 | 473 | 495 | 503 | 28 | -12 | -370 | -268 |
| 2018 | -112 | -55 | 338 | 590 | 618 | 615 | 641 | 618 | 265 | -109 | -262 | -219 |
| 2019 | -187 | -5 | 230 | 538 | 633 | 620 | 640 | 617 | 272 | 29 | -369 | -288 |
| 2020 | -300 | 4 | 251 | 528 | 595 | 470 | 612 | 588 | 299 | -124 | -335 | -236 |
| 2021 | -146 | -81 | 221 | 378 | 602 | 643 | 566 | 509 | 311 | -86 | -473 | -332 |
| 2022 | -- | -- | -- | -- | -- | -- | -- | -- | -- | -- | -- | -- |
| 2023 | -- | -- | -- | -- | -- | -- | -- | -- | -- | -- | -- | -- |
| 2024 | -- | -- | -- | -- | -- | -- | ||||||
| - = No Data Reported; -- = Not Applicable; NA = Not Available; W = Withheld to avoid disclosure of individual company data. |
| Release Date: 8/30/2024 |
| Next Release Date: 9/30/2024 |