|
Download Data (XLS File) |
|
||||||||
|
||||||||
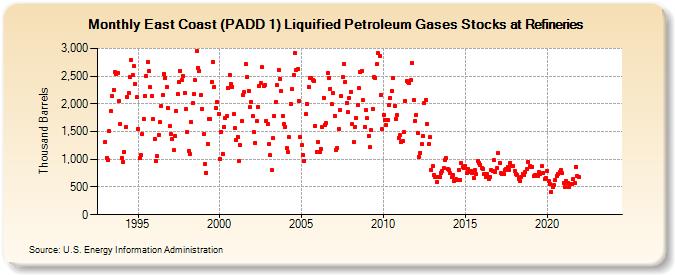
| East Coast (PADD 1) Liquified Petroleum Gases Stocks at Refineries (Thousand Barrels) | ||||||||
| Year | Jan | Feb | Mar | Apr | May | Jun | Jul | Aug | Sep | Oct | Nov | Dec |
|---|---|---|---|---|---|---|---|---|---|---|---|---|
| 1993 | 1,312 | 1,021 | 990 | 1,502 | 1,862 | 2,139 | 2,256 | 2,582 | 2,546 | 2,565 | 2,049 | 1,637 |
| 1994 | 1,028 | 959 | 1,137 | 1,589 | 2,120 | 2,189 | 2,476 | 2,797 | 2,529 | 2,677 | 2,360 | 2,115 |
| 1995 | 1,550 | 1,025 | 1,078 | 1,451 | 1,730 | 2,145 | 2,507 | 2,761 | 2,584 | 2,295 | 2,146 | 1,718 |
| 1996 | 1,372 | 972 | 1,055 | 1,442 | 1,665 | 1,959 | 2,154 | 2,547 | 2,471 | 2,309 | 1,918 | 1,594 |
| 1997 | 1,458 | 1,370 | 1,160 | 1,417 | 1,870 | 2,174 | 2,398 | 2,598 | 2,430 | 2,501 | 2,204 | 1,904 |
| 1998 | 1,495 | 1,151 | 1,095 | 1,671 | 2,014 | 2,175 | 2,423 | 2,954 | 2,648 | 2,595 | 2,167 | 1,913 |
| 1999 | 1,450 | 917 | 758 | 1,279 | 1,734 | 1,725 | 2,391 | 2,762 | 2,300 | 1,933 | 2,026 | 1,820 |
| 2000 | 1,005 | 1,497 | 1,100 | 1,585 | 1,745 | 1,779 | 2,282 | 2,527 | 2,356 | 2,309 | 1,810 | 1,557 |
| 2001 | 1,345 | 1,407 | 976 | 1,250 | 1,685 | 2,152 | 2,215 | 2,715 | 2,488 | 2,238 | 1,934 | 2,038 |
| 2002 | 1,778 | 1,485 | 1,300 | 1,684 | 1,946 | 2,330 | 2,370 | 2,657 | 2,320 | 2,342 | 1,696 | 1,631 |
| 2003 | 1,275 | 1,070 | 810 | 1,378 | 1,785 | 2,041 | 2,337 | 2,614 | 2,455 | 2,224 | 1,786 | 1,638 |
| 2004 | 1,587 | 1,197 | 1,130 | 1,393 | 1,994 | 2,267 | 2,519 | 2,917 | 2,614 | 2,620 | 2,056 | 1,403 |
| 2005 | 1,253 | 1,069 | 973 | 1,816 | 2,002 | 2,307 | 2,470 | 2,470 | 2,434 | 2,417 | 1,603 | 1,138 |
| 2006 | 1,319 | 1,124 | 1,190 | 1,574 | 2,111 | 1,625 | 1,646 | 2,552 | 2,466 | 2,275 | 1,992 | 2,190 |
| 2007 | 1,785 | 1,176 | 1,199 | 1,542 | 1,888 | 2,133 | 2,482 | 2,727 | 2,401 | 2,023 | 1,850 | 2,101 |
| 2008 | 2,215 | 1,631 | 1,312 | 1,587 | 1,745 | 1,972 | 2,281 | 2,568 | 2,600 | 2,061 | 1,588 | 1,886 |
| 2009 | 1,738 | 1,425 | 1,216 | 1,523 | 1,914 | 2,478 | 2,473 | 2,713 | 2,912 | 2,867 | 2,164 | 1,544 |
| 2010 | 1,807 | 1,712 | 1,610 | 1,713 | 1,974 | 2,110 | 2,230 | 2,463 | 1,960 | 1,730 | 1,797 | 1,386 |
| 2011 | 1,433 | 1,316 | 1,329 | 1,488 | 2,051 | 2,413 | 2,394 | 2,377 | 2,429 | 2,741 | 2,077 | 1,697 |
| 2012 | 1,805 | 1,481 | 1,043 | 1,122 | 1,273 | 1,414 | 2,017 | 2,069 | 1,643 | 1,269 | 1,397 | 803 |
| 2013 | 876 | 709 | 683 | 589 | 680 | 682 | 755 | 795 | 837 | 987 | 1,015 | 819 |
| 2014 | 801 | 745 | 675 | 720 | 606 | 638 | 634 | 804 | 631 | 925 | 864 | 846 |
| 2015 | 883 | 756 | 823 | 762 | 784 | 753 | 668 | 804 | 730 | 969 | 939 | 905 |
| 2016 | 839 | 831 | 734 | 682 | 727 | 646 | 683 | 805 | 797 | 980 | 779 | 844 |
| 2017 | 1,114 | 937 | 749 | 735 | 742 | 802 | 824 | 869 | 811 | 934 | 878 | 883 |
| 2018 | 790 | 740 | 718 | 650 | 607 | 677 | 742 | 725 | 778 | 818 | 956 | 878 |
| 2019 | 867 | 868 | 690 | 716 | 722 | 690 | 765 | 731 | 871 | 748 | 638 | 663 |
| 2020 | 795 | 601 | 552 | 417 | 504 | 535 | 623 | 696 | 741 | 774 | 806 | 749 |
| 2021 | 573 | 506 | 608 | 573 | 505 | 554 | 549 | 640 | 568 | 868 | 700 | 676 |
| 2022 | -- | -- | -- | -- | -- | -- | -- | -- | -- | -- | -- | -- |
| 2023 | -- | -- | -- | -- | -- | -- | -- | -- | -- | -- | -- | -- |
| 2024 | -- | |||||||||||
| - = No Data Reported; -- = Not Applicable; NA = Not Available; W = Withheld to avoid disclosure of individual company data. |
| Release Date: 3/29/2024 |
| Next Release Date: 4/30/2024 |