|
Download Data (XLS File) |
|
||||||||
|
||||||||
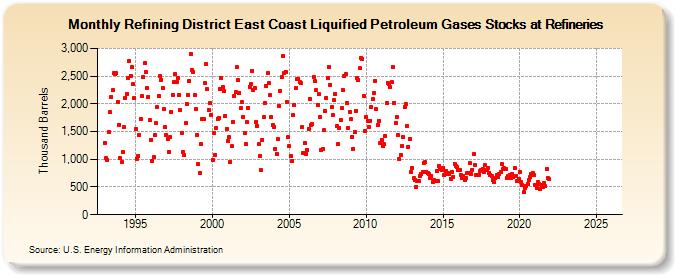
| Refining District East Coast Liquified Petroleum Gases Stocks at Refineries (Thousand Barrels) | ||||||||
| Year | Jan | Feb | Mar | Apr | May | Jun | Jul | Aug | Sep | Oct | Nov | Dec |
|---|---|---|---|---|---|---|---|---|---|---|---|---|
| 1993 | 1,302 | 1,015 | 984 | 1,496 | 1,847 | 2,132 | 2,241 | 2,557 | 2,536 | 2,555 | 2,035 | 1,626 |
| 1994 | 1,020 | 950 | 1,127 | 1,574 | 2,111 | 2,179 | 2,466 | 2,774 | 2,510 | 2,660 | 2,352 | 2,102 |
| 1995 | 1,545 | 1,011 | 1,067 | 1,434 | 1,719 | 2,137 | 2,488 | 2,735 | 2,576 | 2,277 | 2,128 | 1,701 |
| 1996 | 1,353 | 962 | 1,039 | 1,430 | 1,648 | 1,935 | 2,142 | 2,506 | 2,433 | 2,290 | 1,909 | 1,577 |
| 1997 | 1,445 | 1,363 | 1,139 | 1,404 | 1,852 | 2,160 | 2,393 | 2,542 | 2,395 | 2,471 | 2,155 | 1,890 |
| 1998 | 1,482 | 1,128 | 1,081 | 1,653 | 1,995 | 2,163 | 2,413 | 2,902 | 2,611 | 2,582 | 2,153 | 1,905 |
| 1999 | 1,439 | 909 | 753 | 1,274 | 1,720 | 1,718 | 2,377 | 2,723 | 2,261 | 1,895 | 2,012 | 1,802 |
| 2000 | 987 | 1,477 | 1,081 | 1,567 | 1,732 | 1,750 | 2,274 | 2,472 | 2,299 | 2,229 | 1,785 | 1,548 |
| 2001 | 1,337 | 1,396 | 959 | 1,237 | 1,677 | 2,143 | 2,205 | 2,663 | 2,429 | 2,196 | 1,919 | 2,026 |
| 2002 | 1,765 | 1,470 | 1,277 | 1,667 | 1,927 | 2,312 | 2,353 | 2,601 | 2,248 | 2,287 | 1,674 | 1,607 |
| 2003 | 1,267 | 1,058 | 799 | 1,356 | 1,758 | 2,016 | 2,326 | 2,548 | 2,375 | 2,153 | 1,754 | 1,617 |
| 2004 | 1,579 | 1,186 | 1,104 | 1,357 | 1,961 | 2,235 | 2,479 | 2,854 | 2,565 | 2,580 | 2,040 | 1,396 |
| 2005 | 1,239 | 1,053 | 961 | 1,798 | 1,981 | 2,291 | 2,445 | 2,454 | 2,388 | 2,373 | 1,577 | 1,122 |
| 2006 | 1,293 | 1,102 | 1,174 | 1,552 | 2,095 | 1,612 | 1,634 | 2,489 | 2,409 | 2,245 | 1,980 | 2,170 |
| 2007 | 1,769 | 1,163 | 1,184 | 1,522 | 1,873 | 2,109 | 2,459 | 2,670 | 2,345 | 1,944 | 1,803 | 2,063 |
| 2008 | 2,178 | 1,594 | 1,279 | 1,569 | 1,707 | 1,925 | 2,245 | 2,495 | 2,538 | 2,018 | 1,565 | 1,853 |
| 2009 | 1,720 | 1,403 | 1,193 | 1,495 | 1,879 | 2,462 | 2,431 | 2,638 | 2,831 | 2,814 | 2,145 | 1,510 |
| 2010 | 1,764 | 1,687 | 1,590 | 1,695 | 1,935 | 2,082 | 2,195 | 2,417 | 1,899 | 1,618 | 1,691 | 1,291 |
| 2011 | 1,352 | 1,244 | 1,270 | 1,421 | 2,013 | 2,378 | 2,352 | 2,303 | 2,385 | 2,670 | 2,020 | 1,656 |
| 2012 | 1,762 | 1,438 | 998 | 1,086 | 1,236 | 1,398 | 1,944 | 1,994 | 1,601 | 1,226 | 1,366 | 769 |
| 2013 | 843 | 656 | 635 | 505 | 611 | 617 | 690 | 737 | 771 | 933 | 943 | 769 |
| 2014 | 747 | 736 | 665 | 699 | 587 | 624 | 616 | 786 | 603 | 882 | 827 | 809 |
| 2015 | 843 | 710 | 794 | 733 | 761 | 736 | 650 | 770 | 684 | 916 | 885 | 853 |
| 2016 | 803 | 805 | 715 | 665 | 707 | 625 | 660 | 755 | 761 | 925 | 739 | 814 |
| 2017 | 1,089 | 895 | 716 | 711 | 725 | 784 | 807 | 826 | 773 | 888 | 814 | 845 |
| 2018 | 761 | 717 | 696 | 630 | 590 | 657 | 725 | 675 | 735 | 769 | 909 | 830 |
| 2019 | 838 | 828 | 667 | 697 | 708 | 664 | 742 | 683 | 839 | 701 | 609 | 643 |
| 2020 | 770 | 582 | 534 | 404 | 487 | 523 | 556 | 618 | 679 | 738 | 759 | 710 |
| 2021 | 531 | 479 | 590 | 548 | 469 | 535 | 505 | 570 | 514 | 821 | 659 | 636 |
| 2022 | -- | -- | -- | -- | -- | -- | -- | -- | -- | -- | -- | -- |
| 2023 | -- | -- | -- | -- | -- | -- | -- | -- | -- | -- | -- | -- |
| 2024 | -- | |||||||||||
| - = No Data Reported; -- = Not Applicable; NA = Not Available; W = Withheld to avoid disclosure of individual company data. |
| Release Date: 3/29/2024 |
| Next Release Date: 4/30/2024 |
Referring Pages: