|
Download Data (XLS File) |
|
||||||||
|
||||||||
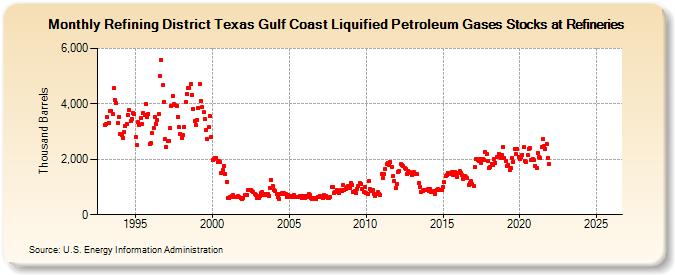
| Refining District Texas Gulf Coast Liquified Petroleum Gases Stocks at Refineries (Thousand Barrels) | ||||||||
| Year | Jan | Feb | Mar | Apr | May | Jun | Jul | Aug | Sep | Oct | Nov | Dec |
|---|---|---|---|---|---|---|---|---|---|---|---|---|
| 1993 | 3,230 | 3,262 | 3,508 | 3,323 | 3,741 | 3,757 | 3,628 | 4,567 | 4,131 | 4,016 | 3,309 | 3,537 |
| 1994 | 2,917 | 2,863 | 2,783 | 2,988 | 3,194 | 3,283 | 3,584 | 3,790 | 3,377 | 3,454 | 3,678 | 3,642 |
| 1995 | 2,791 | 2,513 | 3,341 | 3,238 | 3,474 | 3,281 | 3,664 | 3,587 | 3,984 | 3,531 | 3,647 | 2,569 |
| 1996 | 2,582 | 2,936 | 3,123 | 3,531 | 3,287 | 3,410 | 3,649 | 4,987 | 5,596 | 4,662 | 4,080 | 2,723 |
| 1997 | 2,449 | 2,642 | 2,644 | 3,117 | 3,906 | 4,280 | 3,989 | 3,953 | 3,915 | 3,537 | 3,161 | 2,926 |
| 1998 | 2,782 | 2,859 | 3,166 | 4,076 | 4,369 | 4,585 | 4,576 | 4,719 | 4,323 | 3,805 | 3,367 | 3,238 |
| 1999 | 3,426 | 3,850 | 4,712 | 4,107 | 3,877 | 3,696 | 3,435 | 3,074 | 2,740 | 3,155 | 3,559 | 2,819 |
| 2000 | 1,970 | 2,005 | 2,032 | 2,044 | 1,886 | 1,953 | 1,906 | 1,517 | 1,604 | 1,756 | 1,470 | 1,193 |
| 2001 | 613 | 596 | 651 | 673 | 694 | 656 | 644 | 633 | 659 | 634 | 598 | 582 |
| 2002 | 606 | 695 | 705 | 728 | 901 | 883 | 890 | 844 | 811 | 761 | 707 | 589 |
| 2003 | 615 | 672 | 780 | 819 | 713 | 750 | 714 | 734 | 664 | 976 | 1,249 | 1,042 |
| 2004 | 890 | 852 | 756 | 629 | 580 | 731 | 772 | 736 | 773 | 749 | 625 | 697 |
| 2005 | 692 | 629 | 667 | 624 | 697 | 644 | 628 | 640 | 672 | 689 | 613 | 663 |
| 2006 | 607 | 693 | 632 | 731 | 714 | 597 | 575 | 619 | 609 | 569 | 640 | 653 |
| 2007 | 678 | 634 | 607 | 695 | 626 | 676 | 589 | 612 | 626 | 985 | 982 | 798 |
| 2008 | 833 | 891 | 833 | 786 | 876 | 861 | 1,063 | 905 | 929 | 982 | 1,035 | 980 |
| 2009 | 1,154 | 1,063 | 825 | 840 | 782 | 928 | 1,022 | 1,129 | 1,099 | 912 | 830 | 1,015 |
| 2010 | 782 | 762 | 1,203 | 945 | 840 | 898 | 747 | 685 | 733 | 804 | 754 | 719 |
| 2011 | 1,484 | 1,310 | 1,460 | 1,666 | 1,820 | 1,881 | 1,807 | 1,903 | 1,737 | 1,403 | 1,221 | 973 |
| 2012 | 1,103 | 1,551 | 1,577 | 1,816 | 1,794 | 1,748 | 1,693 | 1,646 | 1,467 | 1,564 | 1,539 | 1,492 |
| 2013 | 1,424 | 1,529 | 1,475 | 1,459 | 1,458 | 1,133 | 1,004 | 828 | 854 | 879 | 883 | 891 |
| 2014 | 916 | 852 | 943 | 830 | 825 | 844 | 752 | 895 | 915 | 890 | 906 | 901 |
| 2015 | 1,016 | 1,169 | 1,383 | 1,439 | 1,508 | 1,482 | 1,455 | 1,533 | 1,447 | 1,541 | 1,442 | 1,371 |
| 2016 | 1,496 | 1,560 | 1,510 | 1,424 | 1,288 | 1,396 | 1,355 | 1,312 | 1,074 | 1,155 | 1,201 | 1,094 |
| 2017 | 1,020 | 1,717 | 2,010 | 1,990 | 1,927 | 2,008 | 1,877 | 1,997 | 1,968 | 2,256 | 2,188 | 1,937 |
| 2018 | 1,702 | 1,721 | 1,835 | 1,796 | 2,014 | 1,878 | 2,089 | 2,075 | 2,188 | 2,060 | 2,150 | 2,433 |
| 2019 | 2,031 | 1,949 | 1,755 | 1,792 | 1,599 | 1,681 | 2,042 | 1,914 | 2,365 | 2,195 | 2,381 | 2,081 |
| 2020 | 2,024 | 2,099 | 2,172 | 2,432 | 1,942 | 1,916 | 2,140 | 2,379 | 2,393 | 1,968 | 2,010 | 1,956 |
| 2021 | 1,770 | 1,702 | 2,237 | 2,085 | 2,062 | 2,447 | 2,744 | 2,473 | 2,387 | 2,561 | 2,042 | 1,825 |
| 2022 | -- | -- | -- | -- | -- | -- | -- | -- | -- | -- | -- | -- |
| 2023 | -- | -- | -- | -- | -- | -- | -- | -- | -- | -- | -- | -- |
| 2024 | -- | -- | -- | -- | -- | -- | ||||||
| - = No Data Reported; -- = Not Applicable; NA = Not Available; W = Withheld to avoid disclosure of individual company data. |
| Release Date: 8/30/2024 |
| Next Release Date: 9/30/2024 |