|
Download Data (XLS File) |
|
||||||||
|
||||||||
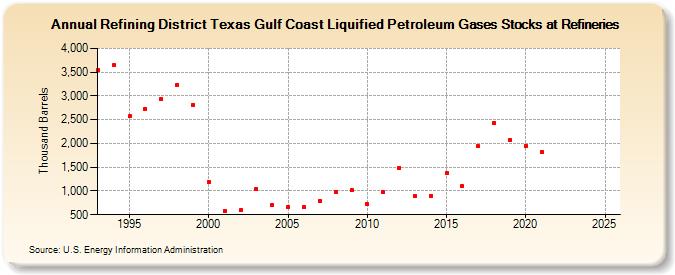
| Refining District Texas Gulf Coast Liquified Petroleum Gases Stocks at Refineries (Thousand Barrels) | ||||||||
| Decade | Year-0 | Year-1 | Year-2 | Year-3 | Year-4 | Year-5 | Year-6 | Year-7 | Year-8 | Year-9 |
|---|---|---|---|---|---|---|---|---|---|---|
| 1990's | 3,537 | 3,642 | 2,569 | 2,723 | 2,926 | 3,238 | 2,819 | |||
| 2000's | 1,193 | 582 | 589 | 1,042 | 697 | 663 | 653 | 798 | 980 | 1,015 |
| 2010's | 719 | 973 | 1,492 | 891 | 901 | 1,371 | 1,094 | 1,937 | 2,433 | 2,081 |
| 2020's | 1,956 | 1,825 | -- | -- |
| - = No Data Reported; -- = Not Applicable; NA = Not Available; W = Withheld to avoid disclosure of individual company data. |
| Release Date: 8/30/2024 |
| Next Release Date: 8/29/2025 |