|
Download Data (XLS File) |
|
||||||||
|
||||||||
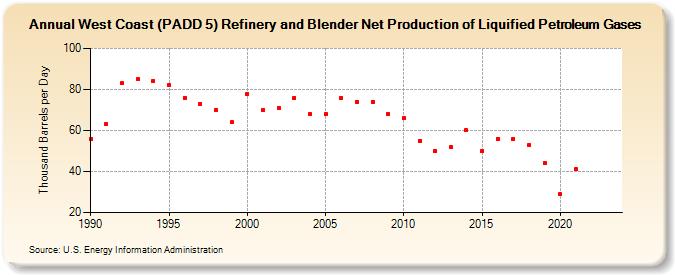
| West Coast (PADD 5) Refinery and Blender Net Production of Liquified Petroleum Gases (Thousand Barrels per Day) | ||||||||
| Decade | Year-0 | Year-1 | Year-2 | Year-3 | Year-4 | Year-5 | Year-6 | Year-7 | Year-8 | Year-9 |
|---|---|---|---|---|---|---|---|---|---|---|
| 1990's | 56 | 63 | 83 | 85 | 84 | 82 | 76 | 73 | 70 | 64 |
| 2000's | 78 | 70 | 71 | 76 | 68 | 68 | 76 | 74 | 74 | 68 |
| 2010's | 66 | 55 | 50 | 52 | 60 | 50 | 56 | 56 | 53 | 44 |
| 2020's | 29 | 41 | -- | -- |
| - = No Data Reported; -- = Not Applicable; NA = Not Available; W = Withheld to avoid disclosure of individual company data. |
| Release Date: 3/29/2024 |
| Next Release Date: 8/30/2024 |