|
Download Data (XLS File) |
|
||||||||
|
||||||||
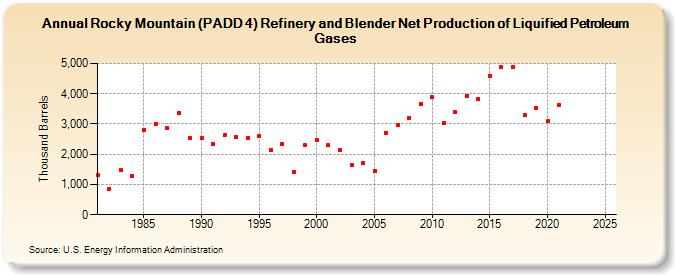
| Rocky Mountain (PADD 4) Refinery and Blender Net Production of Liquified Petroleum Gases (Thousand Barrels) | ||||||||
| Decade | Year-0 | Year-1 | Year-2 | Year-3 | Year-4 | Year-5 | Year-6 | Year-7 | Year-8 | Year-9 |
|---|---|---|---|---|---|---|---|---|---|---|
| 1980's | 1,298 | 847 | 1,468 | 1,295 | 2,805 | 3,005 | 2,860 | 3,367 | 2,544 | |
| 1990's | 2,551 | 2,348 | 2,626 | 2,563 | 2,548 | 2,586 | 2,145 | 2,342 | 1,427 | 2,296 |
| 2000's | 2,454 | 2,303 | 2,153 | 1,638 | 1,714 | 1,440 | 2,697 | 2,961 | 3,205 | 3,675 |
| 2010's | 3,894 | 3,047 | 3,391 | 3,934 | 3,827 | 4,588 | 4,874 | 4,893 | 3,296 | 3,539 |
| 2020's | 3,088 | 3,640 | -- | -- |
| - = No Data Reported; -- = Not Applicable; NA = Not Available; W = Withheld to avoid disclosure of individual company data. |
| Release Date: 3/29/2024 |
| Next Release Date: 8/30/2024 |