|
Download Data (XLS File) |
|
||||||||
|
||||||||
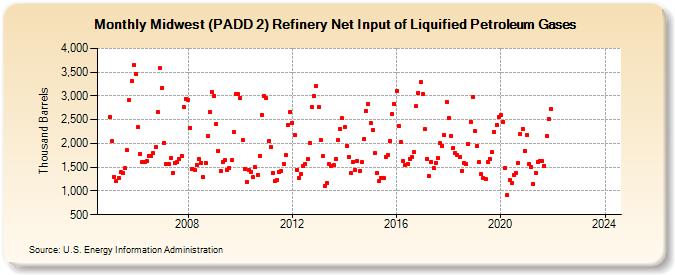
| Midwest (PADD 2) Refinery Net Input of Liquified Petroleum Gases (Thousand Barrels) | ||||||||
| Year | Jan | Feb | Mar | Apr | May | Jun | Jul | Aug | Sep | Oct | Nov | Dec |
|---|---|---|---|---|---|---|---|---|---|---|---|---|
| 2005 | 2,566 | 2,042 | 1,298 | 1,217 | 1,271 | 1,391 | 1,370 | 1,476 | 1,854 | 2,909 | 3,317 | 3,646 |
| 2006 | 3,454 | 2,338 | 1,783 | 1,602 | 1,616 | 1,625 | 1,731 | 1,744 | 1,791 | 1,917 | 2,666 | 3,580 |
| 2007 | 3,177 | 2,010 | 1,567 | 1,559 | 1,685 | 1,387 | 1,580 | 1,616 | 1,665 | 1,740 | 2,772 | 2,941 |
| 2008 | 2,924 | 2,331 | 1,461 | 1,450 | 1,542 | 1,676 | 1,597 | 1,295 | 1,590 | 2,150 | 2,667 | 3,074 |
| 2009 | 3,003 | 2,411 | 1,847 | 1,429 | 1,612 | 1,647 | 1,441 | 1,480 | 1,647 | 2,250 | 3,035 | 3,030 |
| 2010 | 2,962 | 2,078 | 1,458 | 1,194 | 1,440 | 1,406 | 1,291 | 1,496 | 1,344 | 1,743 | 2,606 | 3,005 |
| 2011 | 2,949 | 2,048 | 1,925 | 1,381 | 1,203 | 1,239 | 1,398 | 1,427 | 1,568 | 1,756 | 2,398 | 2,666 |
| 2012 | 2,434 | 2,175 | 1,450 | 1,268 | 1,361 | 1,524 | 1,575 | 1,662 | 2,007 | 2,758 | 2,992 | 3,208 |
| 2013 | 2,768 | 2,079 | 1,727 | 1,105 | 1,170 | 1,562 | 1,527 | 1,546 | 1,670 | 2,064 | 2,309 | 2,529 |
| 2014 | 2,336 | 1,952 | 1,721 | 1,373 | 1,615 | 1,446 | 1,627 | 1,428 | 1,606 | 2,098 | 2,678 | 2,825 |
| 2015 | 2,440 | 2,291 | 1,797 | 1,371 | 1,202 | 1,267 | 1,273 | 1,710 | 1,752 | 2,053 | 2,619 | 2,823 |
| 2016 | 3,111 | 2,370 | 2,030 | 1,628 | 1,546 | 1,562 | 1,679 | 1,706 | 1,821 | 2,786 | 3,067 | 3,286 |
| 2017 | 3,034 | 2,298 | 1,680 | 1,324 | 1,613 | 1,485 | 1,597 | 1,697 | 2,000 | 1,946 | 2,181 | 2,874 |
| 2018 | 2,545 | 2,164 | 1,909 | 1,799 | 1,751 | 1,714 | 1,426 | 1,593 | 1,575 | 1,995 | 2,459 | 2,972 |
| 2019 | 2,263 | 1,947 | 1,600 | 1,347 | 1,271 | 1,249 | 1,599 | 1,675 | 1,812 | 2,250 | 2,393 | 2,563 |
| 2020 | 2,600 | 2,461 | 1,491 | 911 | 1,228 | 1,159 | 1,338 | 1,380 | 1,597 | 2,205 | 2,312 | 1,838 |
| 2021 | 2,179 | 1,576 | 1,514 | 1,156 | 1,379 | 1,614 | 1,636 | 1,631 | 1,535 | 2,156 | 2,507 | 2,723 |
| 2022 | -- | -- | -- | -- | -- | -- | -- | -- | -- | -- | -- | -- |
| 2023 | -- | -- | -- | -- | -- | -- | -- | -- | -- | -- | -- | -- |
| 2024 | -- | |||||||||||
| - = No Data Reported; -- = Not Applicable; NA = Not Available; W = Withheld to avoid disclosure of individual company data. |
| Release Date: 3/29/2024 |
| Next Release Date: 4/30/2024 |
Referring Pages: