|
Download Data (XLS File) |
|
||||||||
|
||||||||
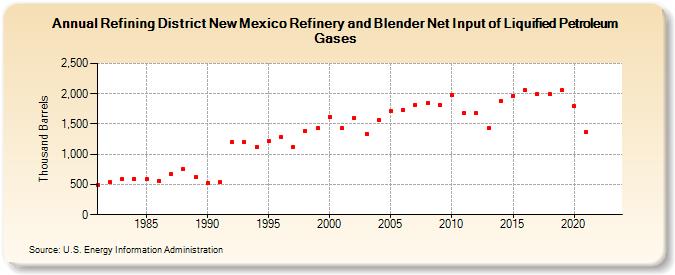
| Refining District New Mexico Refinery and Blender Net Input of Liquified Petroleum Gases (Thousand Barrels) | ||||||||
| Decade | Year-0 | Year-1 | Year-2 | Year-3 | Year-4 | Year-5 | Year-6 | Year-7 | Year-8 | Year-9 |
|---|---|---|---|---|---|---|---|---|---|---|
| 1980's | 483 | 533 | 594 | 593 | 584 | 565 | 667 | 752 | 621 | |
| 1990's | 520 | 535 | 1,198 | 1,203 | 1,119 | 1,211 | 1,282 | 1,121 | 1,385 | 1,433 |
| 2000's | 1,615 | 1,429 | 1,600 | 1,339 | 1,568 | 1,715 | 1,732 | 1,819 | 1,843 | 1,820 |
| 2010's | 1,979 | 1,685 | 1,677 | 1,430 | 1,877 | 1,969 | 2,055 | 1,992 | 1,992 | 2,054 |
| 2020's | 1,796 | 1,365 | -- | -- |
| - = No Data Reported; -- = Not Applicable; NA = Not Available; W = Withheld to avoid disclosure of individual company data. |
| Release Date: 3/29/2024 |
| Next Release Date: 8/30/2024 |