|
Download Data (XLS File) |
|
||||||||
|
||||||||
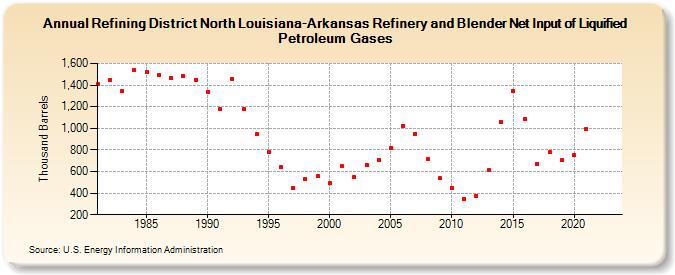
| Refining District North Louisiana-Arkansas Refinery and Blender Net Input of Liquified Petroleum Gases (Thousand Barrels) | ||||||||
| Decade | Year-0 | Year-1 | Year-2 | Year-3 | Year-4 | Year-5 | Year-6 | Year-7 | Year-8 | Year-9 |
|---|---|---|---|---|---|---|---|---|---|---|
| 1980's | 1,409 | 1,450 | 1,346 | 1,538 | 1,518 | 1,489 | 1,465 | 1,482 | 1,451 | |
| 1990's | 1,334 | 1,180 | 1,452 | 1,175 | 945 | 779 | 639 | 447 | 529 | 556 |
| 2000's | 489 | 648 | 548 | 664 | 702 | 816 | 1,025 | 949 | 712 | 537 |
| 2010's | 449 | 348 | 375 | 612 | 1,058 | 1,345 | 1,088 | 673 | 776 | 709 |
| 2020's | 749 | 992 | -- | -- |
| - = No Data Reported; -- = Not Applicable; NA = Not Available; W = Withheld to avoid disclosure of individual company data. |
| Release Date: 3/29/2024 |
| Next Release Date: 8/30/2024 |