|
Download Data (XLS File) |
|
||||||||
|
||||||||
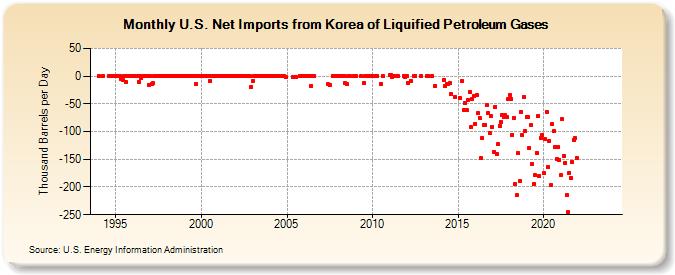
| U.S. Net Imports from Korea of Liquified Petroleum Gases (Thousand Barrels per Day) | ||||||||
| Year | Jan | Feb | Mar | Apr | May | Jun | Jul | Aug | Sep | Oct | Nov | Dec |
|---|---|---|---|---|---|---|---|---|---|---|---|---|
| 1994 | 0 | 0 | 0 | 0 | 0 | |||||||
| 1995 | 0 | 0 | 0 | 0 | -5 | -7 | 0 | -10 | 0 | 0 | 0 | 0 |
| 1996 | 0 | 0 | 0 | 0 | -10 | 0 | -4 | 0 | 0 | 0 | 0 | -16 |
| 1997 | 0 | -14 | -13 | 0 | 0 | 0 | 0 | 0 | 0 | 0 | 0 | 0 |
| 1998 | 0 | 0 | 0 | 0 | 0 | 0 | 0 | 0 | 0 | 0 | 0 | 0 |
| 1999 | 0 | 0 | 0 | 0 | 0 | 0 | 0 | 0 | -15 | 0 | 0 | 0 |
| 2000 | 0 | 0 | 0 | 0 | 0 | 0 | -9 | 0 | 0 | 0 | 0 | 0 |
| 2001 | 0 | 0 | 0 | 0 | 0 | 0 | 0 | 0 | 0 | 0 | 0 | 0 |
| 2002 | 0 | 0 | 0 | 0 | 0 | 0 | 0 | 0 | 0 | 0 | 0 | -19 |
| 2003 | -8 | 0 | 0 | 0 | 0 | 0 | 0 | 0 | 0 | 0 | 0 | 0 |
| 2004 | 0 | 0 | 0 | 0 | 0 | 0 | 0 | 0 | 0 | 0 | 0 | -1 |
| 2005 | -2 | -2 | 0 | 1 | ||||||||
| 2006 | 0 | 0 | 0 | 0 | 0 | -17 | 0 | 0 | ||||
| 2007 | -15 | -16 | 0 | 0 | 0 | 0 | ||||||
| 2008 | 0 | 0 | 0 | 0 | -13 | -15 | 0 | 0 | 0 | |||
| 2009 | 0 | 0 | -12 | 1 | 0 | 1 | 0 | |||||
| 2010 | 0 | 0 | 1 | 0 | -14 | 1 | ||||||
| 2011 | 2 | 2 | -2 | 0 | 0 | 0 | 0 | -2 | ||||
| 2012 | 0 | -12 | -9 | 0 | 0 | 0 | ||||||
| 2013 | 0 | 0 | 0 | -17 | ||||||||
| 2014 | -7 | -18 | -14 | -14 | -13 | -33 | -38 | |||||
| 2015 | -40 | -9 | -61 | -48 | -62 | -43 | -29 | -92 | -41 | -35 | ||
| 2016 | -86 | -34 | -67 | -75 | -148 | -112 | -88 | -88 | -53 | -67 | -102 | -72 |
| 2017 | -91 | -136 | -55 | -140 | -123 | -90 | -83 | -71 | -73 | -71 | -73 | -42 |
| 2018 | -34 | -41 | -106 | -75 | -195 | -215 | -139 | -190 | -64 | -107 | -37 | -99 |
| 2019 | -73 | -74 | -129 | -89 | -159 | -194 | -179 | -138 | -72 | -180 | -111 | -107 |
| 2020 | -175 | -114 | -64 | -164 | -117 | -197 | -87 | -99 | -128 | -150 | -128 | -151 |
| 2021 | -179 | -78 | -144 | -156 | -215 | -246 | -174 | -183 | -155 | -115 | -112 | -148 |
| 2022 | -- | -- | -- | -- | -- | -- | -- | -- | -- | -- | -- | -- |
| 2023 | -- | -- | -- | -- | -- | -- | -- | -- | -- | -- | -- | -- |
| 2024 | -- | |||||||||||
| - = No Data Reported; -- = Not Applicable; NA = Not Available; W = Withheld to avoid disclosure of individual company data. |
| Release Date: 3/29/2024 |
| Next Release Date: 4/30/2024 |