|
Download Data (XLS File) |
|
||||||||
|
||||||||
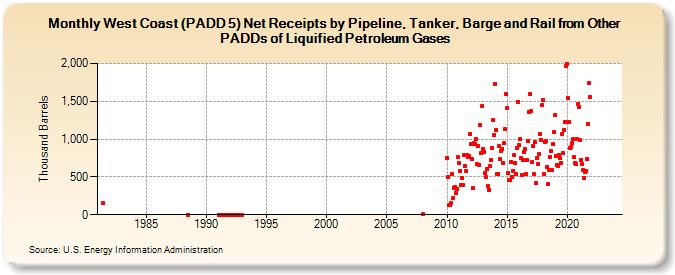
| West Coast (PADD 5) Net Receipts by Pipeline, Tanker, Barge and Rail from Other PADDs of Liquified Petroleum Gases (Thousand Barrels) | ||||||||
| Year | Jan | Feb | Mar | Apr | May | Jun | Jul | Aug | Sep | Oct | Nov | Dec |
|---|---|---|---|---|---|---|---|---|---|---|---|---|
| 1981 | 154 | |||||||||||
| 1988 | 0 | |||||||||||
| 1991 | 0 | 0 | 0 | 0 | 0 | 0 | 0 | 0 | 0 | 0 | 0 | 0 |
| 1992 | 0 | 0 | 0 | 0 | 0 | 0 | 0 | 0 | 0 | 0 | 0 | 0 |
| 2008 | 8 | |||||||||||
| 2010 | 754 | 496 | 123 | 125 | 150 | 537 | 215 | 356 | 370 | 290 | 342 | 768 |
| 2011 | 690 | 582 | 396 | 480 | 390 | 784 | 638 | 576 | 796 | 758 | 773 | 1,067 |
| 2012 | 929 | 737 | 353 | 944 | 932 | 995 | 668 | 914 | 661 | 1,187 | 813 | 1,432 |
| 2013 | 866 | 835 | 549 | 495 | 598 | 378 | 331 | 646 | 720 | 888 | 1,248 | 1,054 |
| 2014 | 1,729 | 1,125 | 542 | 542 | 905 | 732 | 848 | 875 | 689 | 943 | 1,132 | 1,594 |
| 2015 | 1,411 | 546 | 460 | 457 | 701 | 502 | 577 | 791 | 687 | 542 | 884 | 1,494 |
| 2016 | 919 | 1,001 | 745 | 527 | 724 | 830 | 864 | 539 | 719 | 970 | 1,361 | 1,599 |
| 2017 | 1,370 | 692 | 903 | 532 | 958 | 414 | 756 | 671 | 806 | 1,073 | 993 | 1,454 |
| 2018 | 1,523 | 538 | 958 | 970 | 636 | 405 | 585 | 762 | 841 | 589 | 929 | 1,088 |
| 2019 | 1,325 | 776 | 658 | 638 | 790 | 744 | 684 | 1,073 | 816 | 1,121 | 1,231 | 1,962 |
| 2020 | 1,992 | 1,538 | 1,228 | 883 | 899 | 948 | 1,003 | 757 | 684 | 671 | 997 | 1,461 |
| 2021 | 1,425 | 990 | 729 | 668 | 590 | 492 | 565 | 574 | 739 | 1,198 | 1,745 | 1,560 |
| 2022 | -- | -- | -- | -- | -- | -- | -- | -- | -- | -- | -- | -- |
| 2023 | -- | -- | -- | -- | -- | -- | -- | -- | -- | -- | -- | -- |
| 2024 | -- | -- | -- | -- | -- | -- | ||||||
| - = No Data Reported; -- = Not Applicable; NA = Not Available; W = Withheld to avoid disclosure of individual company data. |
| Release Date: 8/30/2024 |
| Next Release Date: 9/30/2024 |
Referring Pages: