|
Download Data (XLS File) |
|
||||||||
|
||||||||
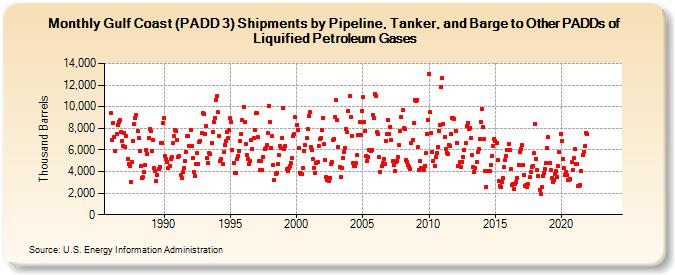
| Gulf Coast (PADD 3) Shipments by Pipeline, Tanker, and Barge to Other PADDs of Liquified Petroleum Gases (Thousand Barrels) | ||||||||
| Year | Jan | Feb | Mar | Apr | May | Jun | Jul | Aug | Sep | Oct | Nov | Dec |
|---|---|---|---|---|---|---|---|---|---|---|---|---|
| 1986 | 9,391 | 6,960 | 8,447 | 7,178 | 5,929 | 7,507 | 8,261 | 8,567 | 8,733 | 7,624 | 6,844 | 6,390 |
| 1987 | 7,598 | 6,302 | 7,279 | 5,154 | 4,649 | 4,506 | 3,063 | 4,874 | 6,812 | 8,421 | 8,916 | 9,243 |
| 1988 | 7,772 | 7,089 | 5,900 | 4,472 | 3,399 | 3,487 | 3,908 | 4,585 | 6,013 | 5,588 | 7,099 | 7,933 |
| 1989 | 7,741 | 5,940 | 6,949 | 4,301 | 4,033 | 3,106 | 3,671 | 4,264 | 4,463 | 6,665 | 6,661 | 8,507 |
| 1990 | 8,951 | 5,405 | 5,142 | 4,886 | 4,361 | 4,515 | 5,170 | 5,388 | 6,614 | 7,283 | 7,840 | 7,704 |
| 1991 | 6,925 | 5,356 | 5,420 | 3,691 | 3,374 | 3,919 | 4,286 | 4,953 | 5,850 | 7,246 | 7,250 | 6,354 |
| 1992 | 7,797 | 6,393 | 5,227 | 3,937 | 3,580 | 4,663 | 5,668 | 4,738 | 6,703 | 6,851 | 7,538 | 9,372 |
| 1993 | 9,315 | 7,504 | 8,195 | 5,219 | 4,774 | 5,719 | 5,585 | 6,638 | 7,628 | 8,559 | 8,980 | 10,598 |
| 1994 | 10,980 | 9,479 | 7,248 | 4,941 | 5,173 | 4,714 | 5,822 | 6,434 | 6,790 | 7,699 | 7,099 | 7,882 |
| 1995 | 8,929 | 8,546 | 5,975 | 4,774 | 3,835 | 3,826 | 5,194 | 5,468 | 5,859 | 6,829 | 7,514 | 8,739 |
| 1996 | 10,008 | 8,545 | 6,537 | 5,529 | 5,134 | 4,651 | 4,969 | 6,904 | 6,098 | 7,147 | 7,808 | 9,380 |
| 1997 | 9,386 | 7,213 | 4,934 | 4,152 | 4,952 | 4,174 | 5,349 | 6,044 | 6,134 | 6,457 | 7,527 | 10,085 |
| 1998 | 8,564 | 6,188 | 7,315 | 4,601 | 3,236 | 3,810 | 3,890 | 4,664 | 5,484 | 6,346 | 6,170 | 7,129 |
| 1999 | 9,858 | 6,043 | 6,376 | 4,229 | 4,039 | 4,281 | 4,474 | 4,754 | 5,214 | 7,289 | 7,489 | 9,048 |
| 2000 | 8,332 | 7,856 | 6,203 | 3,874 | 3,804 | 3,797 | 4,306 | 5,869 | 6,432 | 7,124 | 7,894 | 9,171 |
| 2001 | 9,469 | 6,271 | 6,027 | 5,157 | 4,361 | 3,870 | 4,785 | 4,889 | 6,341 | 6,988 | 7,094 | 7,804 |
| 2002 | 8,964 | 6,534 | 5,099 | 3,496 | 3,190 | 3,149 | 3,445 | 4,712 | 4,841 | 6,873 | 6,984 | 9,091 |
| 2003 | 10,630 | 8,761 | 6,311 | 4,400 | 3,494 | 4,296 | 5,276 | 5,773 | 6,150 | 7,951 | 7,652 | 9,586 |
| 2004 | 10,970 | 9,005 | 7,319 | 4,746 | 4,494 | 4,542 | 4,791 | 5,510 | 7,381 | 8,564 | 7,389 | 9,646 |
| 2005 | 10,868 | 8,564 | 7,795 | 5,436 | 4,927 | 5,371 | 5,986 | 5,933 | 5,995 | 9,239 | 8,928 | 11,194 |
| 2006 | 10,986 | 7,618 | 7,440 | 5,342 | 3,960 | 4,506 | 4,793 | 5,121 | 4,728 | 6,869 | 7,427 | 8,761 |
| 2007 | 7,482 | 8,139 | 6,934 | 4,942 | 4,592 | 4,048 | 4,835 | 5,014 | 5,331 | 6,491 | 7,741 | 9,047 |
| 2008 | 9,660 | 8,032 | 7,901 | 5,077 | 4,887 | 4,558 | 4,426 | 4,241 | 6,614 | 6,951 | 8,524 | 10,574 |
| 2009 | 10,485 | 10,576 | 6,241 | 4,159 | 4,970 | 4,333 | 4,191 | 4,113 | 4,508 | 5,675 | 7,471 | 8,781 |
| 2010 | 13,055 | 9,503 | 7,574 | 5,779 | 4,992 | 4,548 | 5,297 | 5,709 | 6,310 | 7,753 | 8,335 | 11,802 |
| 2011 | 12,646 | 8,378 | 7,188 | 6,118 | 5,754 | 5,597 | 6,499 | 6,369 | 7,472 | 8,965 | 8,911 | 8,871 |
| 2012 | 7,779 | 6,672 | 4,498 | 4,508 | 4,844 | 4,414 | 4,913 | 5,373 | 5,951 | 6,612 | 8,247 | 8,526 |
| 2013 | 7,981 | 8,043 | 7,123 | 5,509 | 4,448 | 3,999 | 4,304 | 4,869 | 5,761 | 6,107 | 7,042 | 8,611 |
| 2014 | 9,820 | 8,084 | 6,977 | 4,069 | 2,606 | 4,079 | 4,064 | 4,035 | 4,567 | 5,469 | 6,397 | 7,026 |
| 2015 | 6,803 | 6,643 | 5,065 | 3,129 | 2,657 | 2,563 | 3,055 | 3,355 | 4,425 | 5,038 | 5,477 | 5,962 |
| 2016 | 6,529 | 5,993 | 4,252 | 2,773 | 2,865 | 2,337 | 2,798 | 3,025 | 3,441 | 4,607 | 5,830 | 6,096 |
| 2017 | 6,435 | 4,615 | 3,719 | 2,697 | 2,768 | 2,552 | 2,833 | 3,466 | 3,960 | 4,437 | 4,513 | 5,701 |
| 2018 | 8,424 | 5,184 | 4,098 | 3,593 | 2,318 | 1,939 | 2,549 | 3,553 | 3,888 | 4,266 | 4,757 | 6,148 |
| 2019 | 7,148 | 4,766 | 4,160 | 3,415 | 3,043 | 3,216 | 3,802 | 4,001 | 3,536 | 4,505 | 5,789 | 7,518 |
| 2020 | 6,865 | 5,157 | 4,355 | 3,722 | 3,936 | 3,696 | 3,245 | 3,242 | 3,271 | 4,834 | 4,123 | 5,226 |
| 2021 | 6,104 | 4,696 | 4,677 | 2,654 | 2,672 | 2,796 | 4,093 | 5,567 | 5,772 | 6,316 | 7,595 | 7,449 |
| 2022 | -- | -- | -- | -- | -- | -- | -- | -- | -- | -- | -- | -- |
| 2023 | -- | -- | -- | -- | -- | -- | -- | -- | -- | -- | -- | -- |
| 2024 | -- | |||||||||||
| - = No Data Reported; -- = Not Applicable; NA = Not Available; W = Withheld to avoid disclosure of individual company data. |
| Release Date: 3/29/2024 |
| Next Release Date: 4/30/2024 |
Referring Pages: