|
Download Data (XLS File) |
|
||||||||
|
||||||||
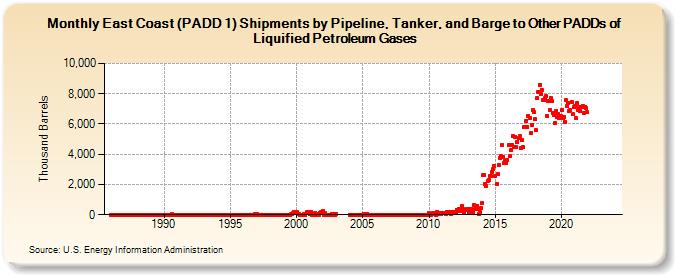
| East Coast (PADD 1) Shipments by Pipeline, Tanker, and Barge to Other PADDs of Liquified Petroleum Gases (Thousand Barrels) | ||||||||
| Year | Jan | Feb | Mar | Apr | May | Jun | Jul | Aug | Sep | Oct | Nov | Dec |
|---|---|---|---|---|---|---|---|---|---|---|---|---|
| 1986 | 0 | 0 | 0 | 0 | 0 | 0 | 0 | 0 | 0 | 0 | 0 | 0 |
| 1987 | 0 | 0 | 0 | 0 | 0 | 0 | 0 | 0 | 0 | 0 | 0 | 0 |
| 1988 | 0 | 0 | 0 | 0 | 9 | 0 | 0 | 0 | 0 | 0 | 0 | 0 |
| 1989 | 0 | 0 | 0 | 0 | 0 | 0 | 0 | 0 | 0 | 0 | 0 | 0 |
| 1990 | 0 | 0 | 0 | 0 | 0 | 0 | 6 | 36 | 8 | 0 | 0 | 0 |
| 1991 | 0 | 0 | 0 | 0 | 0 | 0 | 0 | 0 | 0 | 0 | 0 | 0 |
| 1992 | 0 | 0 | 0 | 0 | 0 | 1 | 0 | 0 | 0 | 0 | 0 | 0 |
| 1993 | 0 | 0 | 0 | 0 | 0 | 0 | 0 | 0 | 0 | 0 | 0 | 0 |
| 1994 | 0 | 0 | 0 | 0 | 0 | 0 | 0 | 0 | 0 | 0 | 0 | 0 |
| 1995 | 0 | 0 | 0 | 0 | 0 | 0 | 0 | 0 | 0 | 0 | 0 | 0 |
| 1996 | 0 | 0 | 0 | 0 | 0 | 0 | 0 | 0 | 0 | 0 | 30 | 20 |
| 1997 | 30 | 0 | 10 | 0 | 0 | 0 | 0 | 0 | 0 | 0 | 0 | 0 |
| 1998 | 0 | 0 | 0 | 0 | 0 | 0 | 0 | 0 | 0 | 0 | 0 | 0 |
| 1999 | 0 | 0 | 0 | 0 | 0 | 0 | 0 | 36 | 53 | 100 | 164 | 209 |
| 2000 | 206 | 15 | 29 | 0 | 0 | 0 | 6 | 25 | 3 | 149 | 184 | 194 |
| 2001 | 16 | 199 | 5 | 26 | 20 | 84 | 0 | 42 | 0 | 112 | 167 | 204 |
| 2002 | 214 | 8 | 96 | 0 | 0 | 0 | 2 | 9 | 53 | 64 | 0 | 0 |
| 2003 | 19 | |||||||||||
| 2004 | 0 | 0 | 0 | 0 | 0 | 0 | 0 | 0 | 0 | 0 | 0 | 0 |
| 2005 | 0 | 75 | 0 | 0 | 70 | 0 | 0 | 0 | 0 | 0 | 0 | 0 |
| 2006 | 0 | 0 | 0 | 0 | 0 | 0 | 0 | 0 | 0 | 0 | 0 | 0 |
| 2007 | 0 | 0 | 0 | 0 | 0 | 0 | 0 | 0 | 0 | 0 | 0 | 0 |
| 2008 | 0 | 0 | 0 | 0 | 0 | 0 | 0 | 0 | 0 | 0 | 0 | 0 |
| 2009 | 0 | 0 | 0 | 0 | 0 | 0 | 0 | 0 | 0 | 0 | 0 | 0 |
| 2010 | 111 | 58 | 14 | 74 | 113 | 41 | 0 | 196 | 37 | 97 | 97 | 35 |
| 2011 | 106 | 116 | 143 | 67 | 182 | 209 | 177 | 200 | 76 | 196 | 172 | 207 |
| 2012 | 107 | 332 | 259 | 396 | 374 | 258 | 600 | 385 | 119 | 340 | 350 | 359 |
| 2013 | 175 | 185 | 410 | 341 | 200 | 643 | 366 | 600 | 410 | 60 | 199 | 473 |
| 2014 | 775 | 2,651 | 2,617 | 2,008 | 1,908 | 2,199 | 2,293 | 2,574 | 2,573 | 2,852 | 3,013 | 3,211 |
| 2015 | 2,573 | 2,023 | 2,675 | 3,313 | 3,735 | 3,897 | 4,596 | 3,810 | 3,435 | 3,548 | 3,444 | 3,602 |
| 2016 | 4,578 | 3,876 | 4,265 | 4,592 | 5,200 | 4,480 | 5,151 | 4,474 | 4,830 | 5,088 | 5,180 | 4,405 |
| 2017 | 4,964 | 4,467 | 5,794 | 5,827 | 6,227 | 5,813 | 6,532 | 6,403 | 5,375 | 5,965 | 6,923 | 6,808 |
| 2018 | 6,308 | 5,574 | 7,724 | 8,116 | 8,601 | 7,956 | 8,248 | 7,568 | 7,554 | 7,693 | 7,841 | 6,554 |
| 2019 | 7,516 | 6,915 | 7,688 | 7,492 | 6,707 | 6,612 | 6,051 | 6,862 | 6,463 | 6,692 | 6,371 | 6,519 |
| 2020 | 6,913 | 6,426 | 6,492 | 6,133 | 7,584 | 7,182 | 7,398 | 6,863 | 6,900 | 7,448 | 6,637 | 7,093 |
| 2021 | 7,203 | 6,382 | 7,358 | 6,893 | 7,122 | 6,869 | 7,103 | 7,200 | 6,740 | 7,122 | 7,053 | 6,760 |
| 2022 | -- | -- | -- | -- | -- | -- | -- | -- | -- | -- | -- | -- |
| 2023 | -- | -- | -- | -- | -- | -- | -- | -- | -- | -- | -- | -- |
| 2024 | -- | -- | -- | -- | -- | -- | ||||||
| - = No Data Reported; -- = Not Applicable; NA = Not Available; W = Withheld to avoid disclosure of individual company data. |
| Release Date: 8/30/2024 |
| Next Release Date: 9/30/2024 |
Referring Pages: