|
Download Data (XLS File) |
|
||||||||
|
||||||||
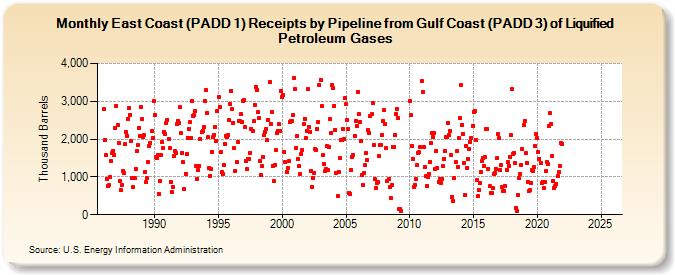
| East Coast (PADD 1) Receipts by Pipeline from Gulf Coast (PADD 3) of Liquified Petroleum Gases (Thousand Barrels) | ||||||||
| Year | Jan | Feb | Mar | Apr | May | Jun | Jul | Aug | Sep | Oct | Nov | Dec |
|---|---|---|---|---|---|---|---|---|---|---|---|---|
| 1986 | 2,784 | 1,964 | 1,572 | 955 | 757 | 773 | 988 | 1,411 | 1,622 | 1,692 | 1,576 | 2,285 |
| 1987 | 2,884 | 2,373 | 1,895 | 895 | 649 | 787 | 1,164 | 1,098 | 1,870 | 2,181 | 2,095 | 2,529 |
| 1988 | 2,811 | 2,649 | 1,959 | 962 | 727 | 961 | 1,216 | 1,677 | 1,836 | 2,304 | 2,085 | 2,850 |
| 1989 | 2,530 | 2,058 | 2,098 | 1,131 | 861 | 960 | 1,400 | 1,823 | 1,903 | 2,202 | 2,031 | 3,000 |
| 1990 | 2,649 | 1,528 | 1,500 | 1,574 | 560 | 899 | 1,569 | 1,916 | 1,762 | 2,179 | 2,145 | 2,439 |
| 1991 | 2,518 | 2,000 | 1,762 | 861 | 605 | 729 | 1,549 | 1,682 | 1,634 | 2,399 | 2,489 | 2,417 |
| 1992 | 2,842 | 2,149 | 1,634 | 1,384 | 669 | 1,089 | 1,596 | 2,039 | 2,272 | 2,441 | 2,036 | 3,003 |
| 1993 | 2,622 | 2,634 | 2,747 | 1,279 | 946 | 1,187 | 1,295 | 2,003 | 2,197 | 2,215 | 2,310 | 3,011 |
| 1994 | 3,287 | 2,688 | 2,043 | 1,230 | 1,034 | 1,221 | 1,671 | 2,065 | 2,120 | 2,327 | 1,960 | 2,753 |
| 1995 | 3,124 | 2,857 | 1,659 | 1,125 | 1,082 | 1,312 | 1,877 | 2,087 | 2,061 | 2,116 | 2,494 | 2,941 |
| 1996 | 3,278 | 2,799 | 2,434 | 1,763 | 1,168 | 1,396 | 1,921 | 2,483 | 2,483 | 2,654 | 2,459 | 3,011 |
| 1997 | 3,024 | 2,310 | 1,418 | 1,207 | 1,481 | 1,475 | 1,642 | 2,272 | 2,212 | 2,472 | 2,915 | 3,387 |
| 1998 | 3,310 | 2,708 | 2,551 | 1,423 | 1,047 | 1,288 | 1,519 | 2,102 | 2,195 | 2,280 | 1,971 | 2,514 |
| 1999 | 3,515 | 2,403 | 2,710 | 1,291 | 884 | 1,313 | 1,700 | 2,162 | 2,214 | 2,390 | 2,225 | 3,266 |
| 2000 | 3,113 | 3,164 | 1,665 | 1,384 | 1,129 | 1,237 | 1,408 | 2,455 | 2,483 | 2,476 | 2,636 | 3,625 |
| 2001 | 3,316 | 1,768 | 2,074 | 1,486 | 1,293 | 1,083 | 1,608 | 1,716 | 2,394 | 2,541 | 2,033 | 2,220 |
| 2002 | 3,318 | 2,317 | 2,196 | 1,165 | 737 | 966 | 1,112 | 1,743 | 1,717 | 2,269 | 2,450 | 3,423 |
| 2003 | 3,570 | 2,878 | 1,577 | 1,348 | 1,147 | 1,218 | 1,815 | 1,187 | 1,801 | 2,527 | 2,151 | 3,424 |
| 2004 | 3,347 | 2,885 | 2,253 | 1,093 | 491 | 1,135 | 1,506 | 1,972 | 1,969 | 2,268 | 2,010 | 3,078 |
| 2005 | 2,926 | 2,510 | 2,276 | 583 | 553 | 1,186 | 1,518 | 1,585 | 2,091 | 2,477 | 2,357 | 3,253 |
| 2006 | 2,657 | 2,457 | 1,947 | 1,063 | 777 | 1,114 | 1,302 | 1,635 | 1,445 | 2,241 | 2,163 | 2,618 |
| 2007 | 2,654 | 2,947 | 1,841 | 937 | 703 | 837 | 870 | 1,553 | 1,849 | 1,844 | 2,120 | 2,481 |
| 2008 | 2,758 | 2,388 | 1,755 | 894 | 941 | 725 | 450 | 784 | 1,785 | 1,785 | 2,120 | 2,659 |
| 2009 | 2,801 | 2,551 | 154 | 154 | 106 | |||||||
| 2010 | 3,004 | 2,636 | 1,820 | 1,476 | 731 | 795 | 937 | 1,314 | 1,631 | 1,650 | 1,793 | 3,528 |
| 2011 | 3,234 | 1,803 | 1,265 | 1,011 | 771 | 1,001 | 1,088 | 1,404 | 1,897 | 2,162 | 2,051 | 2,163 |
| 2012 | 1,221 | 1,696 | 1,234 | 874 | 946 | 838 | 937 | 1,276 | 1,483 | 1,686 | 2,043 | 2,060 |
| 2013 | 2,423 | 2,105 | 2,203 | 1,580 | 481 | 353 | 960 | 1,388 | 1,680 | 1,259 | 2,022 | 2,564 |
| 2014 | 3,420 | 2,381 | 2,145 | 1,375 | 526 | 1,818 | 1,243 | 1,483 | 1,750 | 1,930 | 2,016 | 2,352 |
| 2015 | 2,704 | 2,742 | 1,982 | 907 | 495 | 665 | 829 | 1,124 | 1,411 | 1,488 | 1,300 | 1,517 |
| 2016 | 2,261 | 2,269 | 1,221 | 749 | 578 | 583 | 712 | 1,081 | 1,114 | 1,216 | 1,489 | 2,131 |
| 2017 | 2,022 | 1,181 | 1,307 | 723 | 616 | 640 | 770 | 1,181 | 1,385 | 1,297 | 1,533 | 2,113 |
| 2018 | 3,317 | 1,611 | 1,645 | 1,365 | 173 | 94 | 531 | 962 | 1,083 | 1,305 | 1,751 | 2,361 |
| 2019 | 2,468 | 1,640 | 1,380 | 875 | 617 | 641 | 836 | 1,171 | 1,162 | 1,257 | 1,817 | 2,122 |
| 2020 | 2,029 | 1,652 | 1,483 | 1,373 | 836 | 865 | 698 | 863 | 1,148 | 1,398 | 1,329 | 2,337 |
| 2021 | 2,680 | 2,404 | 1,560 | 887 | 719 | 756 | 820 | 1,023 | 1,141 | 1,299 | 1,904 | 1,878 |
| 2022 | -- | -- | -- | -- | -- | -- | -- | -- | -- | -- | -- | -- |
| 2023 | -- | -- | -- | -- | -- | -- | -- | -- | -- | -- | -- | -- |
| 2024 | -- | |||||||||||
| - = No Data Reported; -- = Not Applicable; NA = Not Available; W = Withheld to avoid disclosure of individual company data. |
| Release Date: 3/29/2024 |
| Next Release Date: 4/30/2024 |