|
Download Data (XLS File) |
|
||||||||
|
||||||||
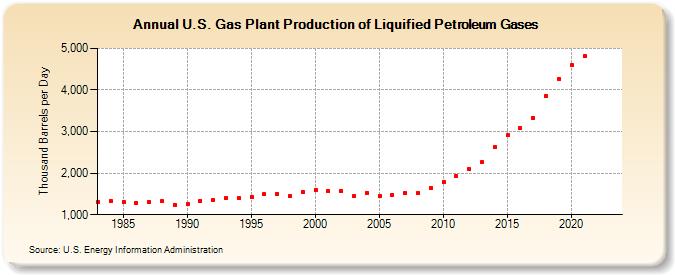
| U.S. Gas Plant Production of Liquified Petroleum Gases (Thousand Barrels per Day) | ||||||||
| Decade | Year-0 | Year-1 | Year-2 | Year-3 | Year-4 | Year-5 | Year-6 | Year-7 | Year-8 | Year-9 |
|---|---|---|---|---|---|---|---|---|---|---|
| 1980's | 1,314 | 1,334 | 1,313 | 1,277 | 1,300 | 1,319 | 1,237 | |||
| 1990's | 1,250 | 1,336 | 1,365 | 1,402 | 1,400 | 1,428 | 1,494 | 1,499 | 1,450 | 1,547 |
| 2000's | 1,605 | 1,562 | 1,581 | 1,444 | 1,532 | 1,451 | 1,476 | 1,520 | 1,520 | 1,639 |
| 2010's | 1,797 | 1,925 | 2,091 | 2,258 | 2,620 | 2,908 | 3,076 | 3,330 | 3,866 | 4,268 |
| 2020's | 4,591 | 4,816 | -- | -- |
| - = No Data Reported; -- = Not Applicable; NA = Not Available; W = Withheld to avoid disclosure of individual company data. |
| Release Date: 3/29/2024 |
| Next Release Date: 8/30/2024 |