|
Download Data (XLS File) |
|
||||||||
|
||||||||
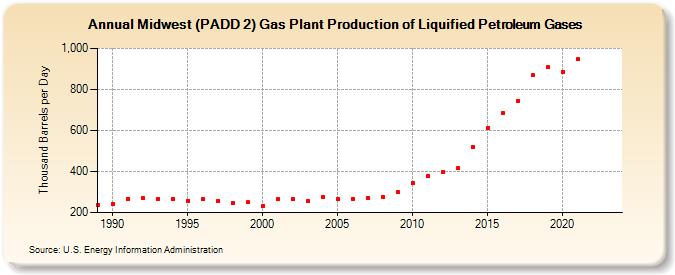
| Midwest (PADD 2) Gas Plant Production of Liquified Petroleum Gases (Thousand Barrels per Day) | ||||||||
| Decade | Year-0 | Year-1 | Year-2 | Year-3 | Year-4 | Year-5 | Year-6 | Year-7 | Year-8 | Year-9 |
|---|---|---|---|---|---|---|---|---|---|---|
| 1980's | 237 | |||||||||
| 1990's | 243 | 267 | 270 | 267 | 267 | 257 | 264 | 257 | 248 | 251 |
| 2000's | 234 | 266 | 266 | 255 | 275 | 265 | 268 | 272 | 276 | 299 |
| 2010's | 345 | 378 | 396 | 415 | 519 | 613 | 684 | 744 | 869 | 907 |
| 2020's | 887 | 946 | -- | -- |
| - = No Data Reported; -- = Not Applicable; NA = Not Available; W = Withheld to avoid disclosure of individual company data. |
| Release Date: 3/29/2024 |
| Next Release Date: 8/30/2024 |