|
Download Data (XLS File) |
|
||||||||
|
||||||||
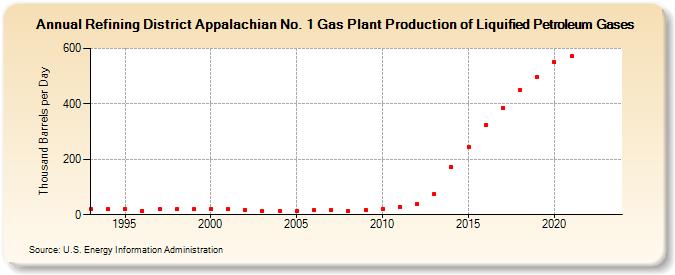
| Refining District Appalachian No. 1 Gas Plant Production of Liquified Petroleum Gases (Thousand Barrels per Day) | ||||||||
| Decade | Year-0 | Year-1 | Year-2 | Year-3 | Year-4 | Year-5 | Year-6 | Year-7 | Year-8 | Year-9 |
|---|---|---|---|---|---|---|---|---|---|---|
| 1990's | 19 | 19 | 19 | 15 | 19 | 19 | 19 | |||
| 2000's | 19 | 20 | 18 | 13 | 14 | 13 | 17 | 16 | 15 | 17 |
| 2010's | 22 | 29 | 37 | 73 | 172 | 245 | 324 | 386 | 451 | 496 |
| 2020's | 550 | 571 | -- | -- |
| - = No Data Reported; -- = Not Applicable; NA = Not Available; W = Withheld to avoid disclosure of individual company data. |
| Release Date: 8/30/2024 |
| Next Release Date: 8/29/2025 |