|
Download Data (XLS File) |
|
||||||||
|
||||||||
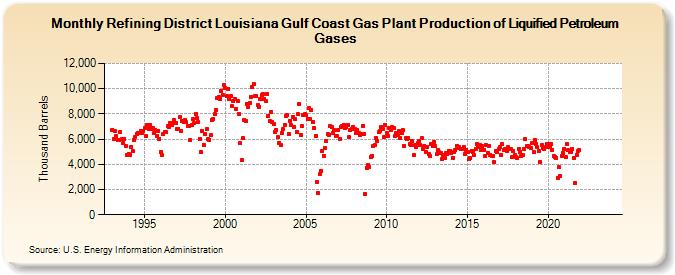
| Refining District Louisiana Gulf Coast Gas Plant Production of Liquified Petroleum Gases (Thousand Barrels) | ||||||||
| Year | Jan | Feb | Mar | Apr | May | Jun | Jul | Aug | Sep | Oct | Nov | Dec |
|---|---|---|---|---|---|---|---|---|---|---|---|---|
| 1993 | 6,744 | 6,015 | 6,621 | 6,246 | 5,965 | 5,913 | 6,543 | 5,992 | 5,694 | 6,038 | 5,463 | 4,767 |
| 1994 | 4,850 | 4,747 | 5,392 | 5,066 | 5,963 | 6,198 | 6,406 | 6,520 | 6,446 | 6,613 | 6,450 | 6,650 |
| 1995 | 6,886 | 6,245 | 7,130 | 6,825 | 7,130 | 6,783 | 6,859 | 6,452 | 6,726 | 6,233 | 6,662 | 6,045 |
| 1996 | 4,996 | 4,711 | 6,443 | 6,558 | 6,540 | 7,027 | 6,972 | 7,263 | 7,081 | 7,313 | 7,477 | 7,271 |
| 1997 | 6,824 | 6,838 | 7,764 | 6,673 | 7,449 | 7,351 | 7,507 | 7,321 | 7,036 | 7,030 | 5,896 | 7,104 |
| 1998 | 7,565 | 7,258 | 8,031 | 7,665 | 7,341 | 6,008 | 4,975 | 6,647 | 5,537 | 6,443 | 6,783 | 5,977 |
| 1999 | 5,968 | 6,298 | 7,535 | 7,601 | 7,965 | 8,305 | 9,281 | 9,367 | 9,161 | 9,809 | 9,512 | 10,287 |
| 2000 | 10,052 | 9,439 | 10,008 | 9,172 | 9,428 | 8,632 | 9,015 | 9,187 | 8,408 | 9,030 | 8,029 | 5,674 |
| 2001 | 4,329 | 6,049 | 7,526 | 7,398 | 8,808 | 8,551 | 8,862 | 9,353 | 10,105 | 10,353 | 9,399 | 9,402 |
| 2002 | 8,697 | 8,580 | 9,151 | 9,498 | 9,569 | 9,211 | 9,060 | 9,615 | 7,860 | 7,407 | 8,170 | 7,329 |
| 2003 | 7,214 | 6,566 | 6,733 | 6,130 | 5,712 | 5,529 | 6,453 | 6,779 | 7,128 | 7,835 | 7,913 | 6,421 |
| 2004 | 7,472 | 7,091 | 7,756 | 6,982 | 7,596 | 6,592 | 7,952 | 8,753 | 6,353 | 7,068 | 7,903 | 7,954 |
| 2005 | 7,928 | 7,605 | 8,434 | 7,632 | 8,304 | 7,342 | 6,891 | 6,239 | 2,566 | 1,745 | 3,239 | 3,495 |
| 2006 | 5,036 | 4,689 | 5,294 | 5,884 | 6,395 | 6,354 | 7,031 | 6,996 | 6,492 | 6,714 | 6,233 | 6,265 |
| 2007 | 6,746 | 5,992 | 6,989 | 7,066 | 7,144 | 6,842 | 6,965 | 7,119 | 6,132 | 6,685 | 6,783 | 6,977 |
| 2008 | 6,774 | 6,460 | 6,739 | 6,515 | 6,347 | 6,367 | 7,056 | 6,426 | 1,625 | 3,728 | 3,962 | 3,775 |
| 2009 | 4,569 | 4,692 | 5,425 | 5,520 | 6,092 | 5,826 | 6,524 | 6,651 | 6,942 | 6,840 | 6,177 | 7,137 |
| 2010 | 6,516 | 6,260 | 6,854 | 6,743 | 6,976 | 6,892 | 6,232 | 6,458 | 6,347 | 6,623 | 6,083 | 6,498 |
| 2011 | 6,700 | 5,455 | 6,058 | 6,020 | 6,101 | 5,575 | 5,498 | 5,824 | 4,734 | 5,522 | 5,347 | 5,666 |
| 2012 | 5,859 | 5,551 | 6,050 | 5,232 | 5,475 | 5,002 | 5,395 | 4,780 | 4,625 | 5,641 | 5,457 | 5,788 |
| 2013 | 5,416 | 4,810 | 5,157 | 4,938 | 4,870 | 4,443 | 4,699 | 4,518 | 4,885 | 4,818 | 5,087 | 5,067 |
| 2014 | 4,873 | 4,516 | 4,938 | 5,104 | 5,475 | 5,304 | 5,364 | 5,206 | 5,241 | 5,397 | 4,789 | 5,169 |
| 2015 | 4,943 | 4,454 | 4,489 | 5,070 | 4,985 | 4,736 | 5,206 | 5,614 | 5,412 | 5,522 | 5,129 | 5,426 |
| 2016 | 5,141 | 4,662 | 5,508 | 4,936 | 5,454 | 4,772 | 4,693 | 4,639 | 4,192 | 5,059 | 4,971 | 5,213 |
| 2017 | 5,351 | 4,762 | 5,592 | 5,152 | 5,233 | 5,057 | 5,360 | 5,232 | 5,185 | 4,577 | 5,047 | 4,751 |
| 2018 | 4,568 | 4,524 | 5,197 | 4,962 | 4,683 | 4,723 | 5,175 | 5,993 | 5,442 | 5,467 | 5,384 | 5,312 |
| 2019 | 5,677 | 4,943 | 5,929 | 5,603 | 5,342 | 5,025 | 4,165 | 5,501 | 5,272 | 5,224 | 5,372 | 5,649 |
| 2020 | 5,578 | 5,354 | 5,596 | 5,136 | 4,645 | 4,556 | 4,504 | 2,934 | 3,759 | 3,057 | 4,646 | 4,921 |
| 2021 | 5,220 | 4,573 | 5,578 | 5,121 | 5,007 | 5,008 | 5,219 | 4,513 | 2,546 | 4,744 | 5,039 | 5,115 |
| 2022 | -- | -- | -- | -- | -- | -- | -- | -- | -- | -- | -- | -- |
| 2023 | -- | -- | -- | -- | -- | -- | -- | -- | -- | -- | -- | -- |
| 2024 | -- | |||||||||||
| - = No Data Reported; -- = Not Applicable; NA = Not Available; W = Withheld to avoid disclosure of individual company data. |
| Release Date: 3/29/2024 |
| Next Release Date: 4/30/2024 |