|
Download Data (XLS File) |
|
||||||||
|
||||||||
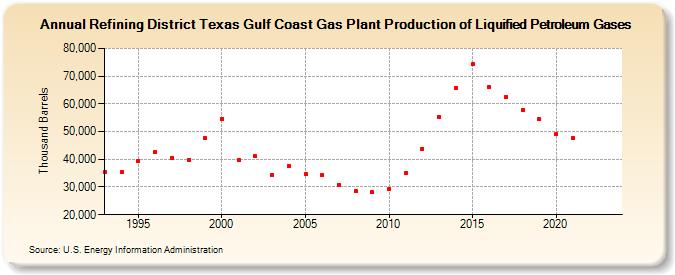
| Refining District Texas Gulf Coast Gas Plant Production of Liquified Petroleum Gases (Thousand Barrels) | ||||||||
| Decade | Year-0 | Year-1 | Year-2 | Year-3 | Year-4 | Year-5 | Year-6 | Year-7 | Year-8 | Year-9 |
|---|---|---|---|---|---|---|---|---|---|---|
| 1990's | 35,345 | 35,386 | 39,319 | 42,567 | 40,397 | 39,755 | 47,626 | |||
| 2000's | 54,621 | 39,684 | 41,072 | 34,326 | 37,629 | 34,580 | 34,333 | 30,819 | 28,620 | 28,070 |
| 2010's | 29,219 | 35,137 | 43,848 | 55,076 | 65,862 | 74,201 | 66,014 | 62,639 | 57,803 | 54,481 |
| 2020's | 49,133 | 47,698 | -- | -- |
| - = No Data Reported; -- = Not Applicable; NA = Not Available; W = Withheld to avoid disclosure of individual company data. |
| Release Date: 3/29/2024 |
| Next Release Date: 8/30/2024 |