|
Download Data (XLS File) |
|
||||||||
|
||||||||
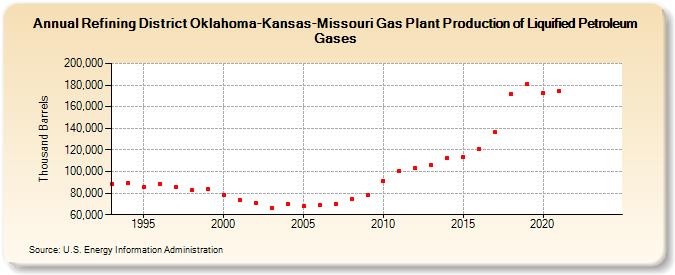
| Refining District Oklahoma-Kansas-Missouri Gas Plant Production of Liquified Petroleum Gases (Thousand Barrels) | ||||||||
| Decade | Year-0 | Year-1 | Year-2 | Year-3 | Year-4 | Year-5 | Year-6 | Year-7 | Year-8 | Year-9 |
|---|---|---|---|---|---|---|---|---|---|---|
| 1990's | 88,684 | 89,432 | 85,675 | 88,870 | 85,415 | 82,532 | 83,667 | |||
| 2000's | 78,251 | 73,744 | 71,043 | 66,102 | 69,987 | 67,710 | 68,613 | 70,324 | 74,131 | 78,230 |
| 2010's | 91,290 | 100,482 | 103,436 | 105,604 | 112,515 | 113,306 | 121,256 | 136,293 | 171,771 | 180,778 |
| 2020's | 172,302 | 174,141 | -- | -- |
| - = No Data Reported; -- = Not Applicable; NA = Not Available; W = Withheld to avoid disclosure of individual company data. |
| Release Date: 3/29/2024 |
| Next Release Date: 8/30/2024 |