|
Download Data (XLS File) |
|
||||||||
|
||||||||
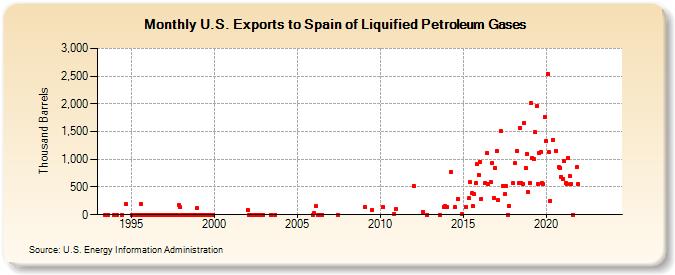
| U.S. Exports to Spain of Liquified Petroleum Gases (Thousand Barrels) | ||||||||
| Year | Jan | Feb | Mar | Apr | May | Jun | Jul | Aug | Sep | Oct | Nov | Dec |
|---|---|---|---|---|---|---|---|---|---|---|---|---|
| 1993 | 1 | 0 | 1 | |||||||||
| 1994 | 1 | 0 | 191 | |||||||||
| 1995 | 0 | 0 | 0 | 0 | 0 | 0 | 0 | 199 | 0 | 0 | 0 | 0 |
| 1996 | 0 | 0 | 0 | 0 | 0 | 0 | 1 | 0 | 0 | 0 | 0 | 0 |
| 1997 | 0 | 0 | 0 | 0 | 0 | 0 | 0 | 0 | 0 | 0 | 172 | 138 |
| 1998 | 0 | 0 | 0 | 0 | 0 | 0 | 0 | 0 | 0 | 0 | 0 | 115 |
| 1999 | 0 | 0 | 0 | 0 | 0 | 0 | 1 | 0 | 0 | 1 | 0 | 0 |
| 2002 | 85 | 0 | 0 | 0 | 0 | 0 | 0 | 0 | 0 | 0 | 0 | 0 |
| 2003 | 0 | 0 | ||||||||||
| 2005 | 0 | |||||||||||
| 2006 | 27 | 149 | 0 | 0 | 0 | |||||||
| 2007 | 0 | |||||||||||
| 2009 | 136 | 90 | ||||||||||
| 2010 | 143 | 13 | 106 | |||||||||
| 2012 | 525 | 49 | 0 | |||||||||
| 2013 | 0 | 136 | 158 | |||||||||
| 2014 | 136 | 771 | 134 | 279 | 5 | |||||||
| 2015 | 140 | 294 | 582 | 383 | 153 | 365 | 564 | 915 | 722 | |||
| 2016 | 957 | 292 | 575 | 1,112 | 550 | 582 | 928 | 301 | 851 | |||
| 2017 | 1,149 | 269 | 1,514 | 511 | 370 | 514 | 0 | 155 | ||||
| 2018 | 571 | 925 | 1,153 | 572 | 1,568 | 572 | 563 | 1,655 | 850 | 1,097 | 414 | |
| 2019 | 575 | 2,007 | 1,023 | 999 | 1,484 | 1,958 | 554 | 1,118 | 1,128 | 575 | 552 | 1,769 |
| 2020 | 1,330 | 2,536 | 1,123 | 250 | 1,356 | 1,158 | 852 | 839 | 679 | |||
| 2021 | 647 | 969 | 575 | 550 | 1,030 | 691 | 550 | 0 | 860 | 550 | ||
| 2022 | -- | -- | -- | -- | -- | -- | -- | -- | -- | -- | -- | -- |
| 2023 | -- | -- | -- | -- | -- | -- | -- | -- | -- | -- | -- | |
| 2024 | -- | |||||||||||
| - = No Data Reported; -- = Not Applicable; NA = Not Available; W = Withheld to avoid disclosure of individual company data. |
| Release Date: 3/29/2024 |
| Next Release Date: 4/30/2024 |