|
Download Data (XLS File) |
|
||||||||
|
||||||||
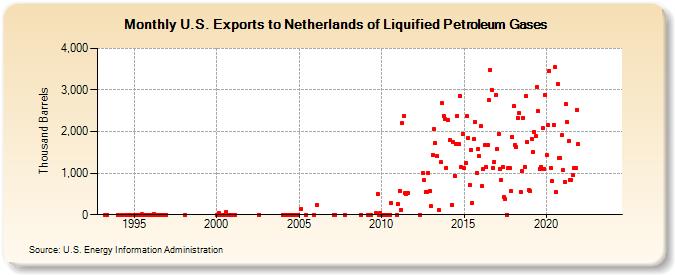
| U.S. Exports to Netherlands of Liquified Petroleum Gases (Thousand Barrels) | ||||||||
| Year | Jan | Feb | Mar | Apr | May | Jun | Jul | Aug | Sep | Oct | Nov | Dec |
|---|---|---|---|---|---|---|---|---|---|---|---|---|
| 1993 | 0 | 1 | ||||||||||
| 1994 | 0 | 0 | 0 | 0 | 0 | 1 | ||||||
| 1995 | 0 | 0 | 0 | 0 | 0 | 1 | 9 | 0 | 0 | 0 | 0 | 0 |
| 1996 | 0 | 0 | 24 | 0 | 0 | 0 | 0 | 0 | 0 | 0 | 0 | 0 |
| 1998 | 0 | |||||||||||
| 2000 | 0 | 0 | 37 | 0 | 0 | 0 | 0 | 75 | 0 | 0 | 0 | 0 |
| 2001 | 0 | |||||||||||
| 2002 | 0 | |||||||||||
| 2004 | 0 | 0 | 0 | 0 | 0 | 0 | 0 | 0 | 0 | 1 | 2 | 0 |
| 2005 | 137 | 0 | 0 | |||||||||
| 2006 | 242 | |||||||||||
| 2007 | 0 | 0 | 1 | |||||||||
| 2008 | 0 | |||||||||||
| 2009 | 0 | 0 | 32 | 500 | 0 | 47 | ||||||
| 2010 | 1 | 1 | 0 | 0 | 0 | 273 | 0 | |||||
| 2011 | 260 | 571 | 125 | 2,203 | 2,366 | 520 | 500 | 520 | ||||
| 2012 | 0 | 993 | 828 | 550 | 550 | 1,013 | 575 | |||||
| 2013 | 200 | 1,439 | 2,055 | 1,725 | 1,412 | 104 | 1,257 | 2,677 | 2,378 | 2,302 | 1,125 | |
| 2014 | 2,283 | 1,788 | 243 | 1,742 | 942 | 1,698 | 2,371 | 1,701 | 2,862 | 1,141 | 1,937 | |
| 2015 | 1,116 | 1,249 | 2,369 | 1,835 | 717 | 1,563 | 287 | 1,825 | 2,231 | 1,007 | 1,572 | 1,404 |
| 2016 | 2,126 | 692 | 1,101 | 1,672 | 1,137 | 1,666 | 2,752 | 3,481 | 3,009 | 1,126 | 1,278 | 2,874 |
| 2017 | 1,575 | 1,946 | 1,102 | 843 | 1,141 | 419 | 372 | 0 | 1,118 | 1,112 | 560 | 1,879 |
| 2018 | 2,604 | 1,682 | 1,623 | 2,330 | 2,441 | 551 | 1,046 | 2,328 | 1,158 | 2,857 | 1,744 | 586 |
| 2019 | 575 | 1,823 | 1,500 | 1,994 | 1,887 | 3,079 | 2,483 | 1,098 | 1,156 | 2,077 | 1,102 | 2,880 |
| 2020 | 1,430 | 2,149 | 3,457 | 1,131 | 807 | 2,159 | 3,550 | 541 | 3,144 | 1,359 | 1,368 | 1,909 |
| 2021 | 1,068 | 793 | 2,660 | 2,224 | 1,769 | 826 | 841 | 956 | 1,121 | 1,123 | 2,525 | 1,698 |
| 2022 | -- | -- | -- | -- | -- | -- | -- | -- | -- | -- | -- | -- |
| 2023 | -- | -- | -- | -- | -- | -- | -- | -- | -- | -- | -- | -- |
| 2024 | -- | |||||||||||
| - = No Data Reported; -- = Not Applicable; NA = Not Available; W = Withheld to avoid disclosure of individual company data. |
| Release Date: 3/29/2024 |
| Next Release Date: 4/30/2024 |