|
Download Data (XLS File) |
|
||||||||
|
||||||||
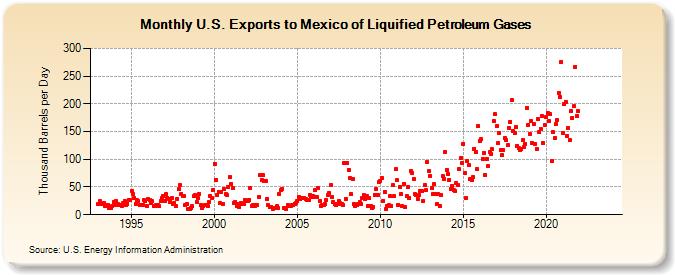
| U.S. Exports to Mexico of Liquified Petroleum Gases (Thousand Barrels per Day) | ||||||||
| Year | Jan | Feb | Mar | Apr | May | Jun | Jul | Aug | Sep | Oct | Nov | Dec |
|---|---|---|---|---|---|---|---|---|---|---|---|---|
| 1993 | 19 | 24 | 19 | 20 | 21 | 16 | 17 | 18 | 12 | 13 | 16 | 23 |
| 1994 | 18 | 25 | 19 | 17 | 17 | 16 | 21 | 25 | 18 | 20 | 27 | 26 |
| 1995 | 43 | 37 | 31 | 20 | 26 | 25 | 17 | 17 | 18 | 26 | 24 | 16 |
| 1996 | 28 | 26 | 22 | 24 | 16 | 16 | 18 | 18 | 15 | 25 | 30 | 33 |
| 1997 | 24 | 37 | 31 | 29 | 23 | 30 | 20 | 21 | 16 | 29 | 46 | 53 |
| 1998 | 38 | 34 | 33 | 18 | 19 | 10 | 11 | 13 | 15 | 33 | 36 | 23 |
| 1999 | 30 | 38 | 17 | 13 | 16 | 17 | 18 | 15 | 23 | 34 | 31 | 45 |
| 2000 | 92 | 63 | 36 | 41 | 21 | 41 | 20 | 46 | 37 | 35 | 50 | 68 |
| 2001 | 56 | 48 | 22 | 23 | 15 | 20 | 14 | 21 | 20 | 20 | 27 | 24 |
| 2002 | 24 | 27 | 48 | 16 | 17 | 15 | 17 | 17 | 32 | 71 | 63 | 71 |
| 2003 | 61 | 61 | 29 | 17 | 14 | 14 | 11 | 12 | 13 | 15 | 13 | 38 |
| 2004 | 44 | 46 | 13 | 12 | 10 | 17 | 15 | 16 | 17 | 18 | 20 | 22 |
| 2005 | 24 | 32 | 28 | 30 | 31 | 31 | 28 | 26 | 27 | 36 | 32 | 34 |
| 2006 | 32 | 44 | 32 | 49 | 24 | 16 | 17 | 17 | 19 | 26 | 35 | 39 |
| 2007 | 53 | 32 | 23 | 19 | 17 | 19 | 24 | 21 | 19 | 17 | 93 | 29 |
| 2008 | 94 | 81 | 66 | 37 | 64 | 19 | 16 | 17 | 20 | 23 | 19 | 30 |
| 2009 | 35 | 28 | 34 | 15 | 30 | 15 | 13 | 14 | 36 | 46 | 35 | 59 |
| 2010 | 61 | 67 | 25 | 41 | 10 | 16 | 17 | 34 | 16 | 53 | 33 | 82 |
| 2011 | 62 | 18 | 50 | 37 | 15 | 56 | 14 | 33 | 50 | 30 | 79 | 76 |
| 2012 | 65 | 37 | 35 | 29 | 36 | 43 | 43 | 25 | 54 | 44 | 95 | 78 |
| 2013 | 70 | 49 | 37 | 55 | 38 | 19 | 37 | 15 | 35 | 69 | 65 | 114 |
| 2014 | 81 | 73 | 63 | 46 | 52 | 44 | 43 | 57 | 54 | 82 | 102 | 93 |
| 2015 | 128 | 76 | 31 | 97 | 89 | 64 | 62 | 68 | 119 | 113 | 82 | 160 |
| 2016 | 133 | 136 | 101 | 112 | 72 | 101 | 87 | 113 | 110 | 118 | 169 | 181 |
| 2017 | 160 | 129 | 148 | 116 | 108 | 117 | 139 | 135 | 125 | 156 | 168 | 207 |
| 2018 | 151 | 147 | 158 | 124 | 120 | 117 | 118 | 135 | 123 | 128 | 193 | 162 |
| 2019 | 146 | 169 | 130 | 164 | 128 | 119 | 172 | 150 | 155 | 178 | 129 | 161 |
| 2020 | 176 | 184 | 169 | 181 | 97 | 149 | 138 | 163 | 170 | 220 | 212 | 275 |
| 2021 | 148 | 200 | 204 | 142 | 156 | 134 | 187 | 175 | 196 | 267 | 178 | 187 |
| 2022 | -- | -- | -- | -- | -- | -- | -- | -- | -- | -- | -- | -- |
| 2023 | -- | -- | -- | -- | -- | -- | -- | -- | -- | -- | -- | -- |
| 2024 | -- | |||||||||||
| - = No Data Reported; -- = Not Applicable; NA = Not Available; W = Withheld to avoid disclosure of individual company data. |
| Release Date: 3/29/2024 |
| Next Release Date: 4/30/2024 |