|
Download Data (XLS File) |
|
||||||||
|
||||||||
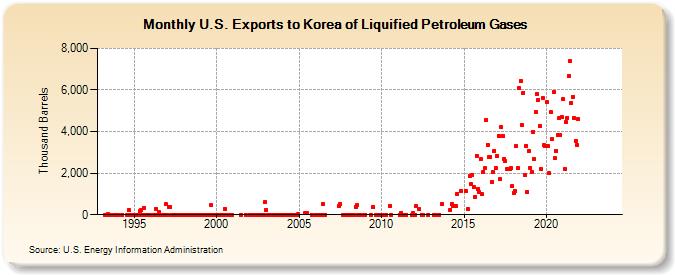
| U.S. Exports to Korea of Liquified Petroleum Gases (Thousand Barrels) | ||||||||
| Year | Jan | Feb | Mar | Apr | May | Jun | Jul | Aug | Sep | Oct | Nov | Dec |
|---|---|---|---|---|---|---|---|---|---|---|---|---|
| 1993 | 4 | 0 | 32 | 0 | 0 | 2 | ||||||
| 1994 | 2 | 2 | 2 | 229 | 1 | 2 | ||||||
| 1995 | 0 | 0 | 4 | 1 | 169 | 206 | 0 | 325 | 0 | 0 | 0 | 0 |
| 1996 | 1 | 0 | 0 | 0 | 298 | 0 | 115 | 0 | 0 | 0 | 0 | 496 |
| 1997 | 0 | 389 | 389 | 0 | 0 | 0 | 0 | 0 | 0 | 0 | 4 | 0 |
| 1998 | 0 | 1 | 0 | 5 | 0 | 0 | 0 | 0 | 0 | 0 | 0 | 1 |
| 1999 | 0 | 0 | 0 | 0 | 0 | 0 | 0 | 0 | 446 | 0 | 0 | 0 |
| 2000 | 0 | 0 | 0 | 0 | 0 | 0 | 289 | 0 | 0 | 0 | 0 | 0 |
| 2001 | 0 | 0 | ||||||||||
| 2002 | 0 | 0 | 0 | 0 | 0 | 1 | 0 | 0 | 1 | 0 | 1 | 602 |
| 2003 | 247 | 0 | 0 | 1 | 1 | 0 | 0 | 0 | 0 | 0 | 0 | 0 |
| 2004 | 0 | 0 | 0 | 0 | 0 | 8 | 2 | 0 | 0 | 2 | 2 | 18 |
| 2005 | 59 | 60 | 7 | |||||||||
| 2006 | 2 | 3 | 0 | 0 | 3 | 505 | 0 | 0 | ||||
| 2007 | 435 | 493 | 0 | 3 | 0 | 0 | ||||||
| 2008 | 0 | 0 | 0 | 0 | 390 | 456 | 0 | 1 | 0 | |||
| 2009 | 0 | 1 | 375 | 0 | 1 | 1 | ||||||
| 2010 | 1 | 1 | 0 | 1 | 434 | 1 | ||||||
| 2011 | 0 | 73 | 1 | 2 | 1 | 0 | 62 | |||||
| 2012 | 0 | 400 | 260 | 1 | 0 | 1 | ||||||
| 2013 | 1 | 0 | 1 | 524 | ||||||||
| 2014 | 228 | 526 | 430 | 430 | 410 | 1,012 | 1,155 | |||||
| 2015 | 1,123 | 265 | 1,882 | 1,455 | 1,912 | 1,340 | 870 | 2,840 | 1,229 | 1,083 | ||
| 2016 | 2,671 | 980 | 2,077 | 2,236 | 4,579 | 3,374 | 2,775 | 2,783 | 1,589 | 2,063 | 3,070 | 2,226 |
| 2017 | 2,818 | 3,808 | 1,710 | 4,200 | 3,800 | 2,693 | 2,566 | 2,191 | 2,205 | 2,216 | 2,242 | 1,373 |
| 2018 | 1,058 | 1,141 | 3,292 | 2,245 | 6,115 | 6,446 | 4,307 | 5,876 | 1,929 | 3,318 | 1,095 | 3,084 |
| 2019 | 2,257 | 2,069 | 3,997 | 2,676 | 4,939 | 5,816 | 5,539 | 4,278 | 2,175 | 5,594 | 3,337 | 3,326 |
| 2020 | 5,429 | 3,316 | 1,994 | 4,925 | 3,618 | 5,906 | 2,706 | 3,077 | 3,836 | 4,638 | 3,834 | 4,680 |
| 2021 | 5,557 | 2,197 | 4,456 | 4,672 | 6,665 | 7,375 | 5,387 | 5,681 | 4,648 | 3,562 | 3,358 | 4,595 |
| 2022 | -- | -- | -- | -- | -- | -- | -- | -- | -- | -- | -- | -- |
| 2023 | -- | -- | -- | -- | -- | -- | -- | -- | -- | -- | -- | -- |
| 2024 | -- | |||||||||||
| - = No Data Reported; -- = Not Applicable; NA = Not Available; W = Withheld to avoid disclosure of individual company data. |
| Release Date: 3/29/2024 |
| Next Release Date: 4/30/2024 |