|
Download Data (XLS File) |
|
||||||||
|
||||||||
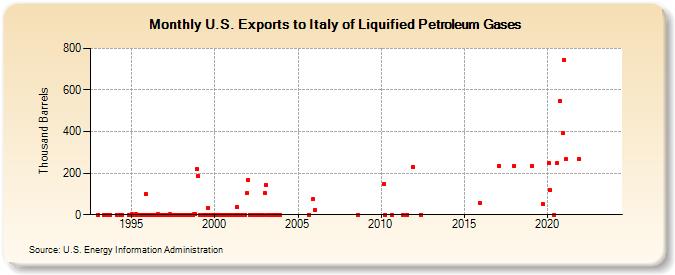
| U.S. Exports to Italy of Liquified Petroleum Gases (Thousand Barrels) | ||||||||
| Year | Jan | Feb | Mar | Apr | May | Jun | Jul | Aug | Sep | Oct | Nov | Dec |
|---|---|---|---|---|---|---|---|---|---|---|---|---|
| 1993 | 1 | 1 | 1 | 1 | 1 | |||||||
| 1994 | 1 | 1 | 1 | 1 | 0 | |||||||
| 1995 | 2 | 0 | 1 | 2 | 0 | 0 | 0 | 0 | 1 | 0 | 100 | 0 |
| 1996 | 0 | 1 | 0 | 1 | 1 | 1 | 0 | 3 | 0 | 0 | 0 | 0 |
| 1997 | 0 | 0 | 1 | 0 | 2 | 0 | 0 | 0 | 0 | 0 | 0 | 0 |
| 1998 | 0 | 0 | 0 | 0 | 0 | 0 | 1 | 0 | 0 | 2 | 2 | 218 |
| 1999 | 184 | 0 | 0 | 0 | 0 | 0 | 0 | 33 | 0 | 0 | 0 | 0 |
| 2000 | 0 | 0 | 1 | 0 | 0 | 0 | 0 | 0 | 0 | 0 | 0 | 0 |
| 2001 | 0 | 0 | 0 | 0 | 37 | 0 | 0 | 0 | 0 | 0 | 0 | 103 |
| 2002 | 168 | 0 | 0 | 0 | 0 | 0 | 0 | 0 | 0 | 0 | 0 | 0 |
| 2003 | 105 | 145 | 0 | 0 | 0 | 0 | 0 | 0 | 0 | 0 | 0 | 0 |
| 2005 | 0 | 74 | ||||||||||
| 2006 | 22 | |||||||||||
| 2008 | 0 | |||||||||||
| 2010 | 150 | 0 | 1 | |||||||||
| 2011 | 1 | 0 | 230 | |||||||||
| 2012 | 1 | |||||||||||
| 2015 | 58 | |||||||||||
| 2017 | 235 | |||||||||||
| 2018 | 236 | |||||||||||
| 2019 | 234 | 50 | ||||||||||
| 2020 | 247 | 117 | 0 | 249 | 548 | 391 | ||||||
| 2021 | 745 | 266 | 267 | |||||||||
| 2022 | -- | -- | -- | -- | -- | -- | ||||||
| 2023 | -- | -- | -- | -- | -- | |||||||
| 2024 | -- | -- | ||||||||||
| - = No Data Reported; -- = Not Applicable; NA = Not Available; W = Withheld to avoid disclosure of individual company data. |
| Release Date: 8/30/2024 |
| Next Release Date: 9/30/2024 |