|
Download Data (XLS File) |
|
||||||||
|
||||||||
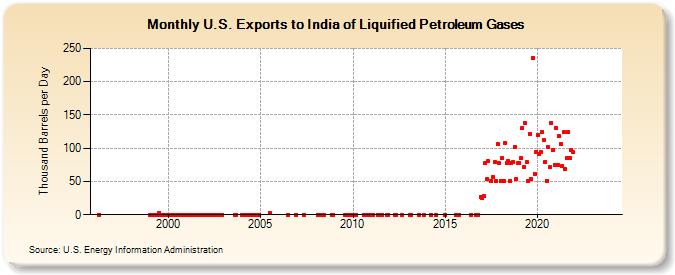
| U.S. Exports to India of Liquified Petroleum Gases (Thousand Barrels per Day) | ||||||||
| Year | Jan | Feb | Mar | Apr | May | Jun | Jul | Aug | Sep | Oct | Nov | Dec |
|---|---|---|---|---|---|---|---|---|---|---|---|---|
| 1996 | 0 | |||||||||||
| 1999 | 0 | 0 | 0 | 0 | 0 | 0 | 3 | 0 | 0 | 0 | 0 | 0 |
| 2000 | 0 | 0 | 0 | 0 | 0 | 0 | 0 | 0 | 0 | 0 | 0 | 0 |
| 2001 | 0 | 0 | 0 | 0 | 0 | 0 | 0 | 0 | 0 | 0 | 0 | 0 |
| 2002 | 0 | 0 | 0 | 0 | 0 | 0 | 0 | 0 | 0 | 0 | 0 | 0 |
| 2003 | 0 | 0 | ||||||||||
| 2004 | 0 | 0 | 0 | 0 | 0 | 0 | 0 | 0 | 0 | 0 | 0 | 0 |
| 2005 | 3 | |||||||||||
| 2006 | 0 | 0 | ||||||||||
| 2007 | 0 | |||||||||||
| 2008 | 0 | 0 | 0 | 0 | 0 | 0 | ||||||
| 2009 | 0 | 0 | 0 | |||||||||
| 2010 | 0 | 0 | 0 | 0 | 0 | 0 | ||||||
| 2011 | 0 | 0 | 0 | 0 | 0 | 0 | 0 | |||||
| 2012 | 0 | 0 | 0 | |||||||||
| 2013 | 0 | 0 | 0 | 0 | ||||||||
| 2014 | 0 | 0 | ||||||||||
| 2015 | 0 | 0 | 0 | |||||||||
| 2016 | 0 | 0 | 0 | 27 | ||||||||
| 2017 | 25 | 28 | 77 | 53 | 80 | 51 | 56 | 79 | 51 | 106 | 77 | |
| 2018 | 51 | 85 | 51 | 108 | 77 | 81 | 51 | 77 | 79 | 102 | 53 | 77 |
| 2019 | 77 | 85 | 130 | 71 | 138 | 79 | 51 | 122 | 53 | 236 | 61 | 95 |
| 2020 | 120 | 91 | 94 | 125 | 112 | 79 | 51 | 102 | 71 | 138 | 97 | 75 |
| 2021 | 130 | 75 | 118 | 107 | 73 | 124 | 68 | 85 | 124 | 85 | 98 | 94 |
| 2022 | -- | -- | -- | -- | -- | -- | -- | -- | -- | -- | -- | -- |
| 2023 | -- | -- | -- | -- | -- | -- | -- | -- | -- | -- | -- | -- |
| 2024 | -- | |||||||||||
| - = No Data Reported; -- = Not Applicable; NA = Not Available; W = Withheld to avoid disclosure of individual company data. |
| Release Date: 3/29/2024 |
| Next Release Date: 4/30/2024 |