|
Download Data (XLS File) |
|
||||||||
|
||||||||
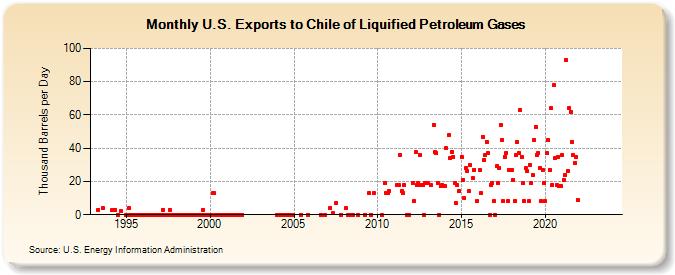
| U.S. Exports to Chile of Liquified Petroleum Gases (Thousand Barrels per Day) | ||||||||
| Year | Jan | Feb | Mar | Apr | May | Jun | Jul | Aug | Sep | Oct | Nov | Dec |
|---|---|---|---|---|---|---|---|---|---|---|---|---|
| 1993 | 3 | 4 | ||||||||||
| 1994 | 3 | 3 | 3 | 0 | 2 | |||||||
| 1995 | 0 | 0 | 4 | 0 | 0 | 0 | 0 | 0 | 0 | 0 | 0 | 0 |
| 1996 | 0 | 0 | 0 | 0 | 0 | 0 | 0 | 0 | 0 | 0 | 0 | 0 |
| 1997 | 0 | 0 | 3 | 0 | 0 | 0 | 0 | 3 | 0 | 0 | 0 | 0 |
| 1998 | 0 | 0 | 0 | 0 | 0 | 0 | 0 | 0 | 0 | 0 | 0 | 0 |
| 1999 | 0 | 0 | 0 | 0 | 0 | 0 | 0 | 3 | 0 | 0 | 0 | 0 |
| 2000 | 0 | 0 | 13 | 13 | 0 | 0 | 0 | 0 | 0 | 0 | 0 | 0 |
| 2001 | 0 | 0 | 0 | 0 | 0 | 0 | 0 | 0 | 0 | 0 | 0 | 0 |
| 2004 | 0 | 0 | 0 | 0 | 0 | 0 | 0 | 0 | 0 | 0 | 0 | 0 |
| 2005 | 0 | 0 | ||||||||||
| 2006 | 0 | 0 | ||||||||||
| 2007 | 4 | 1 | 7 | 0 | ||||||||
| 2008 | 4 | 0 | 0 | 0 | 0 | |||||||
| 2009 | 0 | 13 | 0 | 13 | ||||||||
| 2010 | 0 | 19 | 13 | 13 | 14 | |||||||
| 2011 | 18 | 18 | 36 | 14 | 13 | 18 | 0 | 0 | ||||
| 2012 | 19 | 8 | 38 | 18 | 19 | 36 | 18 | 18 | 0 | 19 | ||
| 2013 | 19 | 18 | 54 | 38 | 37 | 19 | 0 | 17 | 18 | |||
| 2014 | 17 | 40 | 48 | 34 | 38 | 35 | 19 | 7 | 18 | 14 | ||
| 2015 | 35 | 21 | 10 | 28 | 26 | 14 | 30 | 22 | 27 | 8 | ||
| 2016 | 27 | 13 | 47 | 33 | 36 | 44 | 37 | 0 | 18 | 19 | 8 | |
| 2017 | 0 | 29 | 19 | 28 | 54 | 45 | 8 | 35 | 37 | 8 | 27 | |
| 2018 | 27 | 21 | 8 | 36 | 44 | 37 | 63 | 35 | 19 | 8 | 28 | 26 |
| 2019 | 8 | 30 | 19 | 24 | 45 | 53 | 36 | 37 | 28 | 8 | 27 | 19 |
| 2020 | 8 | 37 | 45 | 27 | 64 | 18 | 78 | 34 | 18 | 35 | 17 | 17 |
| 2021 | 36 | 21 | 24 | 93 | 26 | 64 | 62 | 44 | 36 | 31 | 35 | 9 |
| 2022 | -- | -- | -- | -- | -- | -- | -- | -- | -- | -- | -- | -- |
| 2023 | -- | -- | -- | -- | -- | -- | -- | -- | -- | -- | -- | -- |
| 2024 | -- | |||||||||||
| - = No Data Reported; -- = Not Applicable; NA = Not Available; W = Withheld to avoid disclosure of individual company data. |
| Release Date: 3/29/2024 |
| Next Release Date: 4/30/2024 |