|
Download Data (XLS File) |
|
||||||||
|
||||||||
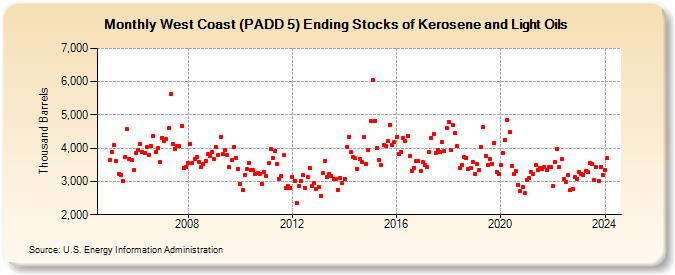
| West Coast (PADD 5) Ending Stocks of Kerosene and Light Oils (Thousand Barrels) | ||||||||
| Year | Jan | Feb | Mar | Apr | May | Jun | Jul | Aug | Sep | Oct | Nov | Dec |
|---|---|---|---|---|---|---|---|---|---|---|---|---|
| 2005 | 3,659 | 3,886 | 4,094 | 3,601 | 3,227 | 3,181 | 3,025 | 3,735 | 4,567 | 3,685 | 3,653 | 3,338 |
| 2006 | 3,842 | 3,950 | 4,117 | 3,900 | 3,841 | 4,040 | 3,810 | 4,070 | 4,380 | 3,878 | 3,991 | 3,582 |
| 2007 | 4,314 | 4,231 | 4,286 | 4,597 | 5,617 | 4,128 | 3,969 | 4,067 | 4,071 | 4,679 | 3,407 | 3,440 |
| 2008 | 3,546 | 4,120 | 3,561 | 3,686 | 3,724 | 3,587 | 3,444 | 3,532 | 3,621 | 3,815 | 3,778 | 3,891 |
| 2009 | 3,674 | 4,026 | 3,809 | 4,327 | 3,821 | 3,939 | 3,783 | 3,429 | 3,634 | 4,025 | 3,717 | 3,373 |
| 2010 | 2,917 | 2,728 | 3,200 | 3,362 | 3,566 | 3,345 | 3,333 | 3,217 | 3,240 | 3,232 | 2,937 | 3,277 |
| 2011 | 3,156 | 3,543 | 3,971 | 3,699 | 3,922 | 3,528 | 3,078 | 3,159 | 3,782 | 2,792 | 2,871 | 2,813 |
| 2012 | 3,134 | 3,028 | 2,341 | 2,859 | 3,016 | 3,184 | 2,818 | 3,126 | 3,395 | 2,851 | 2,942 | 2,783 |
| 2013 | 2,819 | 2,573 | 3,255 | 3,607 | 3,121 | 3,238 | 3,155 | 3,082 | 3,072 | 2,750 | 3,102 | 2,968 |
| 2014 | 3,083 | 4,040 | 4,328 | 3,876 | 3,723 | 3,692 | 3,376 | 3,689 | 3,581 | 4,329 | 3,532 | 3,932 |
| 2015 | 4,822 | 6,054 | 4,811 | 4,000 | 3,644 | 3,495 | 4,091 | 4,068 | 4,229 | 4,707 | 4,085 | 4,174 |
| 2016 | 4,331 | 3,836 | 3,899 | 4,308 | 4,219 | 4,354 | 3,765 | 3,316 | 3,414 | 3,619 | 3,602 | 3,314 |
| 2017 | 3,578 | 3,480 | 3,421 | 3,893 | 4,305 | 4,414 | 3,866 | 3,949 | 3,888 | 4,181 | 3,902 | 4,620 |
| 2018 | 4,790 | 3,948 | 4,688 | 4,446 | 4,055 | 3,402 | 3,488 | 3,727 | 3,713 | 3,366 | 3,415 | 3,592 |
| 2019 | 3,225 | 3,528 | 3,346 | 4,028 | 4,633 | 3,773 | 3,495 | 3,664 | 3,529 | 4,167 | 3,284 | 3,231 |
| 2020 | 3,497 | 3,846 | 4,257 | 4,861 | 4,500 | 3,474 | 3,235 | 3,301 | 2,906 | 2,707 | 2,831 | 2,643 |
| 2021 | 3,048 | 3,118 | 3,279 | 3,211 | 3,495 | 3,337 | 3,416 | 3,375 | 3,446 | 3,337 | 3,437 | 3,423 |
| 2022 | 2,851 | 3,589 | 3,980 | 3,431 | 3,678 | 3,077 | 2,995 | 3,197 | 2,744 | 2,782 | 3,121 | 3,084 |
| 2023 | 3,287 | 3,217 | 3,191 | 3,329 | 3,287 | 3,545 | 3,530 | 3,056 | 3,424 | 3,015 | 3,447 | 3,206 |
| 2024 | 3,349 | |||||||||||
| - = No Data Reported; -- = Not Applicable; NA = Not Available; W = Withheld to avoid disclosure of individual company data. |
| Release Date: 3/29/2024 |
| Next Release Date: 4/30/2024 |