|
Download Data (XLS File) |
|
||||||||
|
||||||||
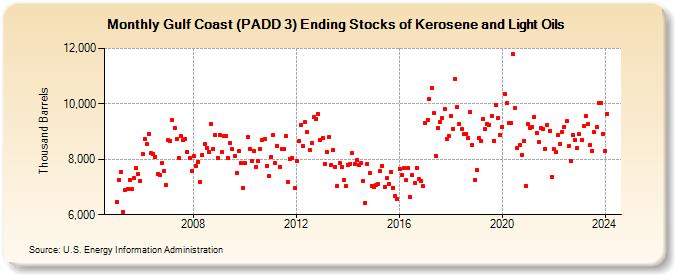
| Gulf Coast (PADD 3) Ending Stocks of Kerosene and Light Oils (Thousand Barrels) | ||||||||
| Year | Jan | Feb | Mar | Apr | May | Jun | Jul | Aug | Sep | Oct | Nov | Dec |
|---|---|---|---|---|---|---|---|---|---|---|---|---|
| 2005 | 6,466 | 7,258 | 7,532 | 6,091 | 6,895 | 6,916 | 7,264 | 6,935 | 7,321 | 7,673 | 7,469 | 7,206 |
| 2006 | 8,190 | 8,728 | 8,541 | 8,918 | 8,210 | 8,200 | 8,088 | 7,461 | 7,423 | 7,861 | 7,561 | 7,078 |
| 2007 | 8,679 | 8,674 | 9,410 | 9,142 | 8,741 | 8,034 | 8,833 | 8,678 | 8,736 | 8,272 | 8,038 | 7,576 |
| 2008 | 8,108 | 7,748 | 7,911 | 7,183 | 8,169 | 8,551 | 8,409 | 8,264 | 9,286 | 8,378 | 8,864 | 8,046 |
| 2009 | 8,893 | 8,257 | 8,823 | 8,851 | 8,030 | 8,605 | 8,360 | 8,131 | 7,509 | 8,302 | 7,852 | 6,976 |
| 2010 | 7,855 | 8,799 | 8,373 | 7,935 | 8,290 | 7,718 | 7,924 | 8,365 | 8,694 | 8,745 | 7,765 | 7,386 |
| 2011 | 8,098 | 8,864 | 7,851 | 8,476 | 7,733 | 8,373 | 8,366 | 8,837 | 7,189 | 8,013 | 8,031 | 6,956 |
| 2012 | 7,946 | 8,644 | 9,238 | 8,480 | 9,329 | 8,983 | 8,344 | 8,574 | 9,516 | 9,462 | 9,636 | 8,711 |
| 2013 | 8,767 | 7,839 | 8,269 | 8,790 | 7,803 | 8,328 | 7,734 | 7,028 | 7,854 | 7,710 | 7,265 | 7,044 |
| 2014 | 7,805 | 7,839 | 8,234 | 7,832 | 7,973 | 7,789 | 7,856 | 7,220 | 6,437 | 7,836 | 7,498 | 7,046 |
| 2015 | 6,983 | 7,063 | 7,096 | 7,566 | 7,772 | 7,010 | 7,327 | 7,115 | 7,535 | 6,975 | 6,683 | 6,556 |
| 2016 | 7,665 | 7,438 | 7,675 | 7,249 | 7,678 | 6,636 | 7,419 | 7,130 | 7,702 | 7,278 | 7,203 | 7,018 |
| 2017 | 9,303 | 9,434 | 10,169 | 10,574 | 9,669 | 8,127 | 9,143 | 9,354 | 9,480 | 9,821 | 8,728 | 8,847 |
| 2018 | 9,567 | 9,107 | 10,896 | 9,888 | 9,282 | 9,087 | 8,898 | 8,904 | 8,777 | 9,719 | 8,511 | 7,259 |
| 2019 | 7,598 | 8,764 | 8,674 | 9,464 | 9,083 | 9,278 | 9,238 | 9,573 | 8,670 | 9,943 | 9,483 | 8,881 |
| 2020 | 9,175 | 10,363 | 10,014 | 9,317 | 9,320 | 11,795 | 9,838 | 8,415 | 8,514 | 8,172 | 8,650 | 7,040 |
| 2021 | 9,255 | 9,132 | 9,160 | 9,520 | 8,943 | 8,607 | 9,125 | 9,089 | 8,374 | 9,253 | 9,025 | 7,358 |
| 2022 | 8,355 | 8,255 | 8,875 | 8,560 | 8,996 | 9,178 | 9,363 | 8,473 | 7,928 | 8,875 | 8,705 | 8,422 |
| 2023 | 8,896 | 8,699 | 9,190 | 9,560 | 9,262 | 8,516 | 8,307 | 8,968 | 9,147 | 10,031 | 10,024 | 8,924 |
| 2024 | 8,313 | |||||||||||
| - = No Data Reported; -- = Not Applicable; NA = Not Available; W = Withheld to avoid disclosure of individual company data. |
| Release Date: 3/29/2024 |
| Next Release Date: 4/30/2024 |